The combination of phase analysis, density and microstructure using an X-ray platform allows to correlate meso- to nanoscopic features with material properties and to estimate the durability of concrete.
The combination of X-ray methods to investigate concrete bars by a laboratory X-ray measurement to determine density, mineral formation, mineral distribution and finally 3-dimensional results on microstructure is described.
The combination of X-ray methods to investigate concrete bars by a laboratory X-ray measurement to determine density, mineral formation, mineral distribution and finally 3-dimensional results on microstructure is described. For this purpose two different concretes were used: one with norm sand and cement and one in which the sand was partially replaced by glass powder. It is expected that the addition of glass powder should change the properties of the concrete as well as it substitutes parts of the total amount of clinker, used for the concrete, and therefore the CO2 emission during production is reduced. The applied X-ray laboratory methodology gives information on: Density (0D), phase formation (1D), microstructure (fabric) and pore distribution (3D).
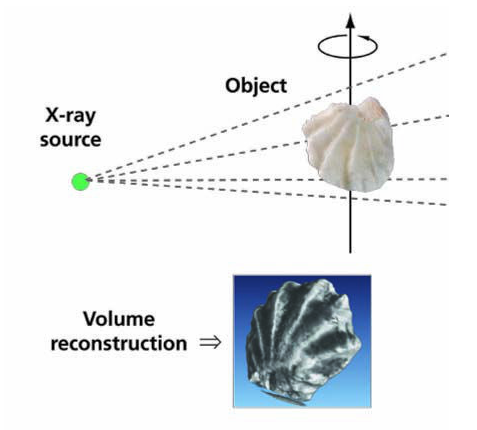
The fundamental principle behind computed tomography is to acquire multiple views of an object over range of angular orientations. In this way, additional dimensional data are obtained in comparison to conventional X-radiography, in which there is only one view. In our experiments we use the so-called volume CT method, where a cone beam or highly-collimated, thick, parallel beam is used in combination with a 2D (area) detector. The radiation transmitted through the object at each angle is measured and the detector data is stored as 2D X-ray images. The series of 2D X-ray projections, used to generate 3D images, is a collection of images acquired while progressively rotating the sample step by step through a full 360-degree rotation within the field of view at increments of less than 1 degree per step. These projections (effectively: X-ray attenuation data) represent a measure of the reduction in X-ray intensity that result from absorption and scattering by the sample and contain information on the position and density of absorbing object features within the sample.
The accumulated 2D projections data is then used for the numerical reconstruction of the volumetric data (volume rendering). This volume data is compiled as a visualization of the reconstructed layers in a 3D view by CT reconstruction software, which provides these 3D volume results using the Filtered Back-Projection algorithm (the co-called ‘Feldkamp’ algorithm). The 3D CT data are rendered as voxels (volume element) with three- dimensional resolution depending on the X-ray detector pixel size. In general, any sample that can fit entirely within the field of view and can be penetrated by X-rays can be imaged in this way. The energy spectrum of the X-ray source defines the penetrative ability of the X-rays, as well as their expected relative attenuation as they pass through materials of different density. Higher-energy X-rays penetrate more effectively than lower-energy ones, but are less sensitive to changes in material density and composition. The X-ray intensity directly affects the signal-to- noise ratio and thus image clarity.
Usually it is necessary to apply different complementary techniques to characterize samples in an adequate way. For example the following methods are used to analyze concrete norm bars according to the different norms:
• Microscopy multiple sections
• Porosity measurements by mercury intrusion
• X-ray diffraction for characterization and quantification of the phases
• Physical tests Compressive strength Tensile strength Expansion Permeability
• Density determination
The time consumption of these tests is quite often a critical constraint for the cement researcher. The required manpower as well as the infrastructure and consumables are many times judged as too high load compared with the outcome.
All experiments were done on an Empyrean X-ray diffraction instrument equipped with a PIXcel3D detector. This unique detector allowed the measurement of density, phase composition, micro-structure, porosity, and pore size and shape.
Samples
The samples are 2 mm thick slices of concrete norm bars. One sample is made of 75% norm sand and 25% OPC, one third of the OPC compound was replaced by glass for the second sample. The Figures 1-4 describe the samples.
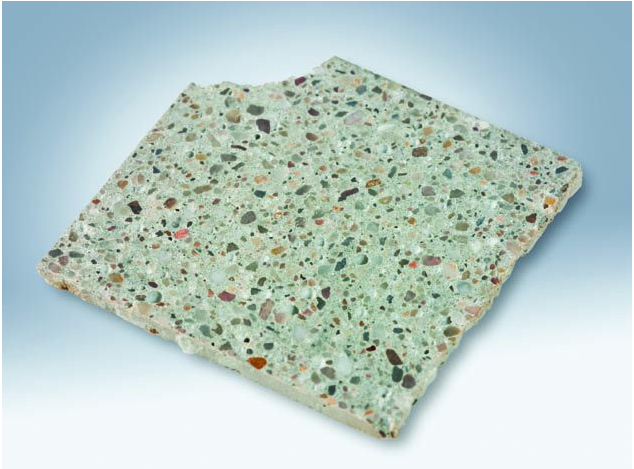
Figure 1: Macroscopic view of the concrete sample
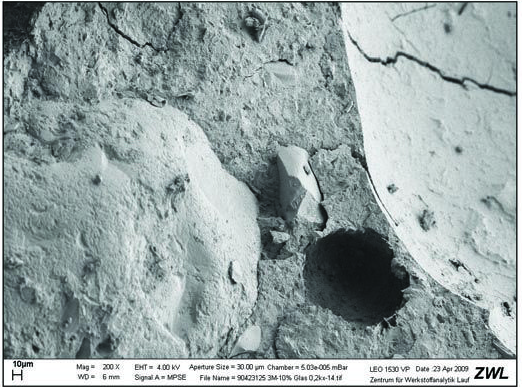
Figure 2: Microscopic sample description, pores, sand grains and hydrated cement
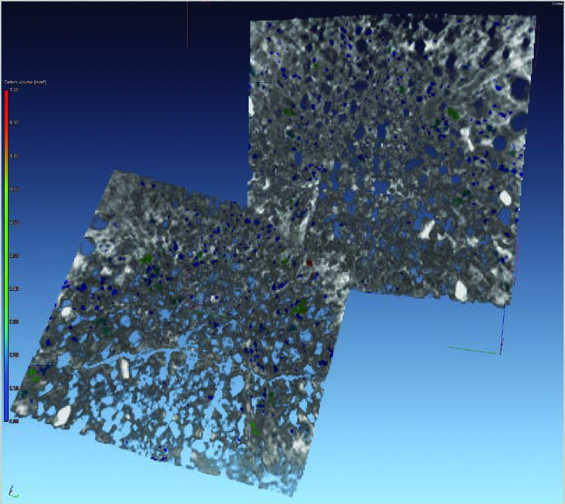
Figure 3: Microstructure and pore distribution determined with VG Studio MAX 2.1 (Volume Graphics), Empyrean system in CT mode, 15 minutes measurement time
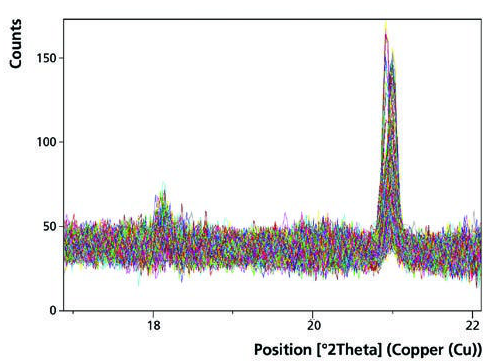
Figure 4: Phase analysis showing portlandite and quartz diagrams summarized from different local spots on the bar determined with HighScore Plus 3.0
The density measurement was performed by measuring the overall intensity transmitted through the sample. The data was analyzed by VG Studio MAX 2.1 manufactured by Volume Graphics. A density measurement is a very relevant characterization because in many cases a direct relation between density and compressive strength and/or other physical properties can be found. Physical tests are generally destructive, which makes it difficult to use more than one methodology for the same sample. A combination of various non- destructive analytical methods provides a clearly more complete characterization of the sample.
The scans for phase analysis were performed in the classical Bragg- Brentano type setup to achieve the optimal measurement resolution as well as the best achievable crystallite statistics. A difference in the quantitative ratios of the phases portlandite and calcite can be seen, this is indicated by the different peak sizes of the corresponding reflections. The glass phase cannot be seen in the diffractogram because of the missing crystalline properties of the material. The sample without glass contains reduced amounts of portlandite and enriched concentration of calcite compared with the sample with glass. The consequences of the differences in the phase composition will be discussed later.
3D results
The microstructure analysis shows a clear difference between the two samples. The sample ‘with glass’ has less pores (Figure 7) and a more dense fabric. The pore distribution of the sample ‘with glass’ shows a smaller variation bandwidth. The CT images of the glass-reinforced cement concrete sample indicate that this type of concrete material is characterized by a distinctly more ‘rigid’ structure than standard concrete, which consists of cement and sand (mainly quartz) in a roughly 1:3 ratio. This conclusion should already come from the density measurements, but here it becomes visible what is causing it. CT imaging with the PIXcel3D detector reveals a very distinctive porosity and cementation of the constituents. The pore volume can be quantified and is 3% for the sample with glass and 20% for the sample without glass.
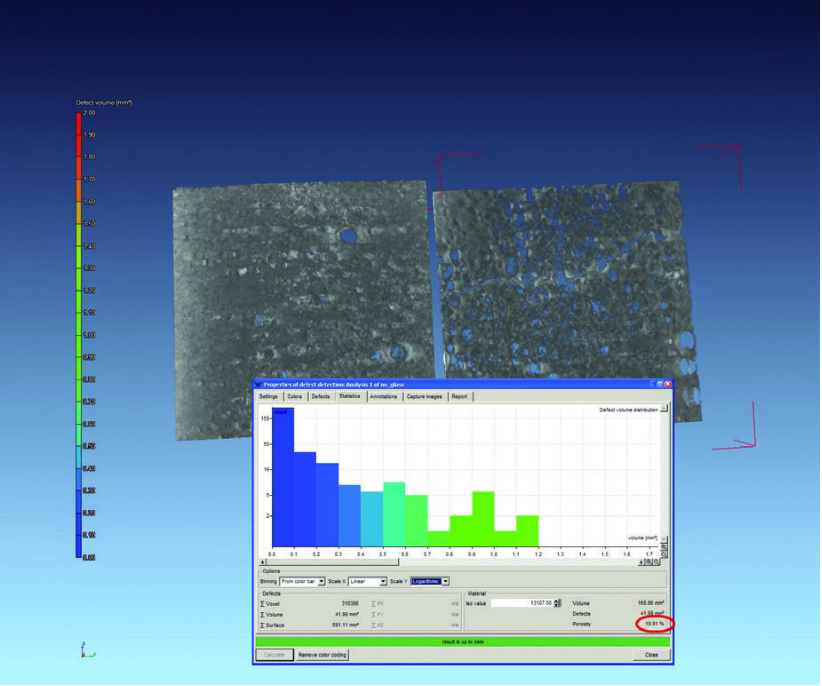
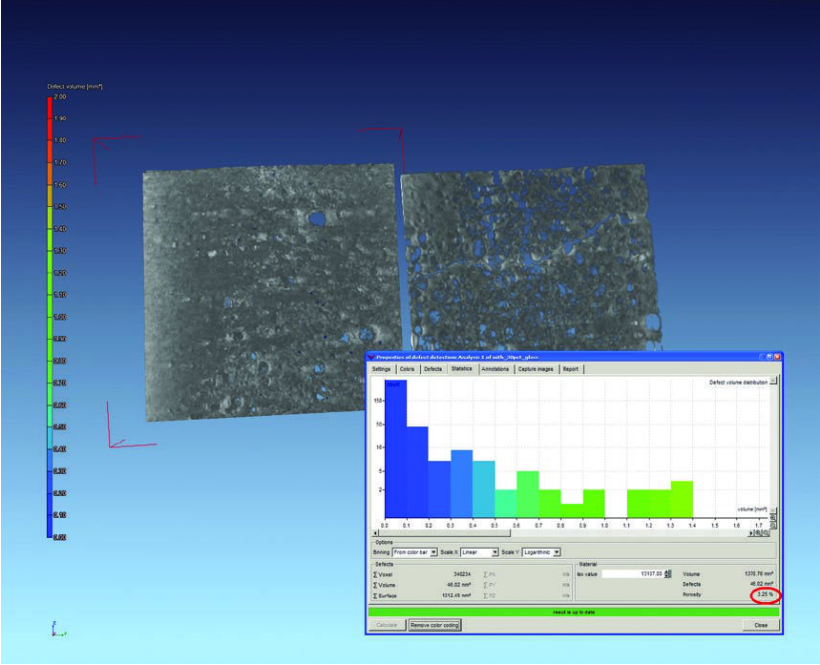
Figures 4 and 5: 3D measurement- porosity analysis
In Figure 6 the quartz grains (medium grey) are embedded in the cement clinker matrix (yellowish in the highlighted center of the picture) with a distinct narrow reaction rim (lighter grey). The densely intergrown matrix of this material underlines its rigidity. Even more important is the porosity and the pore shape. The porosity is related to the amount of water that was used for the concrete. This explains the rigidity of the material, as well as the low permeability of this material, compared to standard concretes. In Figure 7 this is highlighted in an inverted 3D view of the concrete sample, showing the pore distribution and the pores’ shape and size.
This picture is another example of the magnificent displaying power of the X-ray CT technique, when using a very high resolution PIXcel3D detector.
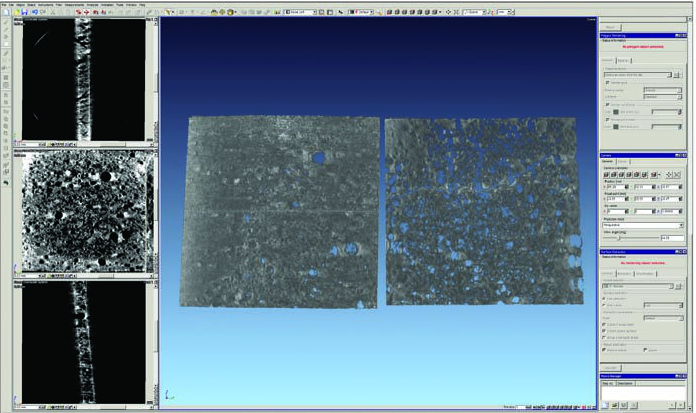
Figure 9: CT slice of glass-reinforced concrete, highlighting the mode of intergrowth between the sand grains (quartz, medium grey) and the cement matrix (yellowish). The rectangular central main section is used for the analysis.
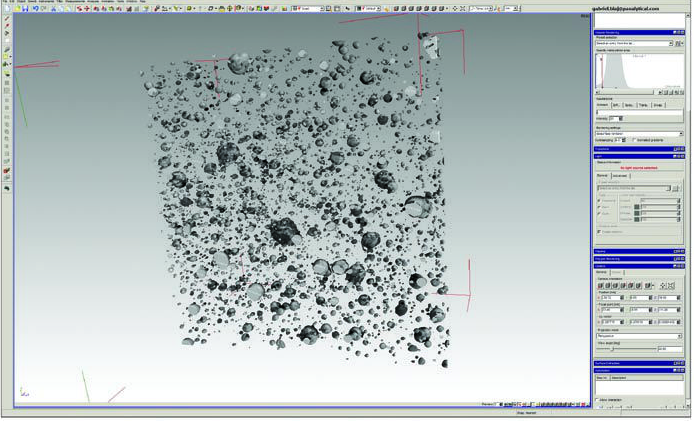
Figure 10: 3D CT image in an ‘inverted’ view, highlighting the pores and their spatial distribution in the concrete sample
The addition of the glass causes a different behavior of the cementitious paste during the hardening process. This is reflected in a higher density and lower porosity of the sample ‘with glass’ and subsequently in the physical properties (compressive strength). Furthermore the denser microstructure (lower porosity) leads to a protection of the portlandite phase Ca(OH)2, which is beneficial for the prevention of corrosion of steel wiring in reinforced concrete. The presence of the portlandite phase leads to an alkalization of the concrete, which protects iron based materials from corrosion. Corrosion would occur when the unprotected portlandite reacts over time to become calcite CaCO3, this means the (OH) group is substituted by CO2, a process called carbonation.
The combination of various methods to characterize cementitious materials increases the quality of the analysis and the subsequent interpretation of the data significantly. Especially the parallel use of 0D, 1D and 3D X-ray analysis methods forms a powerful logical combination to get a realistic characterization and subsequent interpretation of cementitious samples. The strong point in using this methodology lies in the combination of data that is based on local information (3D) with integral data (0D and 1D), which enables the user to correlate (micro-) structural information with phase information. Another important point to mention is that all methods used are non-destructive: multiple analyses can be carried out on the same sample. Sample preparation is easy: there is no need to cut very thin slices for optical microscopy, or use intrusion methods for determining the porosity. All these advantages are vital for the proper evaluation and interpretation of the collected data and for the understanding of the involved reactions.
We thank Herbert Pöllmann, herbert.poellmann@geo.uni-halle.de, University of Halle/Mineralogy/Germany, for providing the samples and the information for this application note.