An important step in drug development is the investigation of polymorphs, chemically identical substances present in different crystallographic forms. Active pharmaceutical ingredients often occur in various polymorphic forms, potentially displaying different dissolution properties and therefore different bioavailability. Some may even be more effective than the originally discovered substance.
This application note describes the use of a PANalytical X-ray powder diffractometer for high-throughput, high-resolution polymorph screening.
An important step in drug development is the investigation of polymorphs, chemically identical substances present in different crystallographic forms. Active pharmaceutical ingredients often occur in various polymorphic forms, potentially displaying different dissolution properties and therefore different bioavailability. Some may even be more effective than the originally discovered substance.
Polymorph analysis and salt screening can aid the selection of a suitable solid form of a drug to optimize its critical properties. Polymorph screening and identification are also important for patent applications. Often several polymorphic phases can be synthesized that have similar efficacy. It is therefore essential that pharmaceutical companies discover and patent all polymorphs, hydrates and solvates of a drug that may have some therapeutic effect.
Furthermore, XRPD is accepted methodology for new product registrations and patent applications- an indexed XRPD pattern or (single-) crystal structure is now common when securing a patent.
X-ray powder diffraction (XRPD) is used increasingly in the pharmaceutical industry. Advances in hardware and software, especially the advent of fast X-ray detectors and software for high-throughput applications, have reduced measurement times and improved detection limits. This well-established technique is now generating critical data in many areas of drug discovery, development and manufacture.
XRPD offers significant advantages over other commonly used techniques: non-destructive testing provides essential data without sacrificing samples; analysis of final dosage forms allows determination of the integrity of the active pharmaceutical ingredient in the finished product; crystalline impurities can be detected down to 0.05% levels; and morphological changes can be identified during production.
High-throughput technologies have been developed to allow the rapid investigation of large numbers of drug polymorphs. The aim is to crystallize as many polymorphs as possible or to investigate which usable salts can be formed. This is done through parallel crystallization experiments using different sets of parameters. Crystallization methods, solvents, temperature ramps or additives are all varied to create multi- dimensional parameter variations. Raman spectroscopy and XRPD are the techniques used most commonly for the sample analysis stage of the process. But also other techniques like DSC or NMR are common. The experiment below demonstrates the effectiveness of PANalytical’s system for high-resolution, high-throughput polymorph screening.
High-throughput screening is now commonplace in pharmaceutical development. One important application when developing new drugs is in the identification of diverse solid forms of pharmaceutical substances. This application note describes the use of a PANalytical X-ray powder diffractometer for high- throughput, high-resolution polymorph screening. Until recently, screening instruments have typically delivered only low- resolution data, often requiring the subsequent use of a second technique for high-resolution analysis. The results presented here demonstrate that the diffractometer provides rapid data collection with unsurpassed data quality, making possible the use of a single analytical system.
Cimetidine, a histamine receptor antagonist, is used to suppress the secretion of stomach acid. In this study, cimetidine from Sigma-Aldrich was dissolved in various solvents (isopropanol, water, ethanol and acetic acid) and dispensed into 96-well plates with Mylar foil, for re-crystallization. Concentration and temperature were varied to generate a large number of combinations. In total around 160 samples were analyzed.
Measurements were performed using a PANalytical diffractometer equipped with a (PreFIX) high-throughput stage in transmission mode. An elliptical focusing mirror with anti-scatter slit was used as the incident beam optic, with an X’Celerator RTMS detector with anti- scatter device on the diffracted beam side. To limit axial divergence of the beam, 0.04 rad Soller slits were used on both sides. An additional 4 mm mask on the incident beam side was chosen to adapt the beam length to the well dimensions and prevent over-irradiation of the wells.
Scan data were collected using the Operator Interface, which simplifies the measurement of samples on a pre- defined grid, such as a well plate. On each well, 2θ-ω scans from 2 to 45 degrees were performed with different ω offsets (wobble-scans) to reduce particle statistic effects. Total scan time was approximately 5 minutes per well; 10 minutes in the case of wells containing very little sample. Data analysis was carried out using the HighScore Plus software package. This comprehensive analytical toolbox enables: qualitative search-match analysis; crystallographic analysis, including indexing, cell refinement and Rietveld refinement; and automated full pattern cluster analysis.
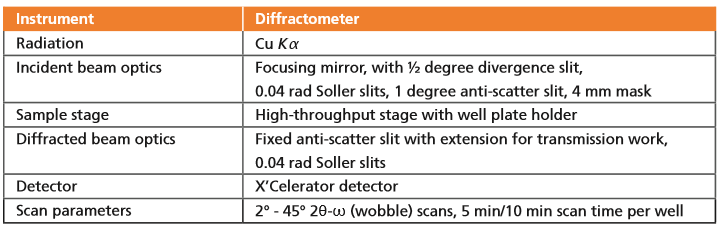
Samples were measured in transmission geometry with the following parameters:
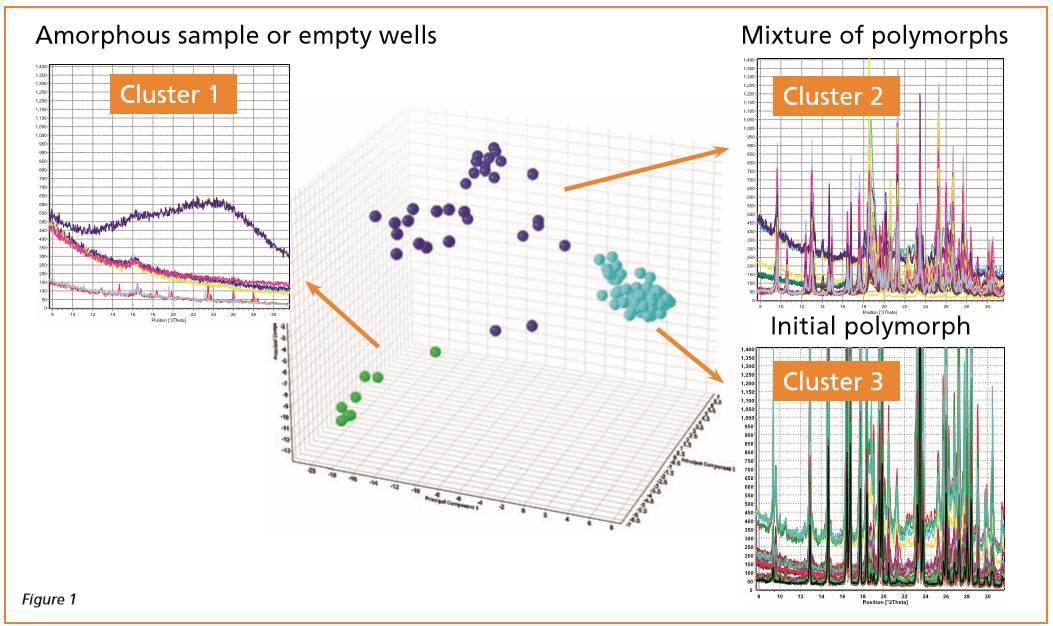
Initially, normal cluster analysis was applied to the data set. The HighScore Plus software automatically sorts closely related scans into clusters, and indicates the most representative scan from each cluster as well as outlying patterns. PANalytical’s cluster analysis module uses algorithms from commonly used statistical packages together with proprietary PANalytical algorithms.
Figure 1 shows results from the initial cluster analysis. The three-dimensional PCA score plot is shown. This is a typical statistical treatment for data sets that allows visual confirmation of observed scan clusters. Three clusters are highlighted: the green represents amorphous samples or measurements on almost empty wells; light blue is the group in which the original polymorph has re-crystallized; and dark blue represents a set of scan files that remains quite diverse and might contain multiple polymorphs or mixtures.
It was evident that the dark blue cluster required further analysis and separation, but unfortunately further separation into sub-clusters (or fuzzy clustering for cluster validation) did not deliver clear results. Therefore additional analysis was undertaken using a new approach that involves the automated indexing of all scans. Such a step would not be possible using conventional high-throughput polymorph studies because of the absence of high-resolution data. Additional sample handling and measurements would be needed, on a separate instrument. An additional difficulty may also be the need to re-crystallize samples to produce the larger amounts required for measurement with conventional high-resolution systems. The PANalytical system, however, offers both high throughput and high resolution. The data quality of the initial scans is sufficiently high to allow further analysis following the first cluster analysis: the same data sets can be used for indexing and full pattern fits; and there is no need to measure samples with another instrument configuration to generate new data sets.
Using the automated approach, all scans were treated within the same batch; they were smoothed and the background determined. Afterwards a peak search was performed (ignoring small reflections) and an automated indexing step (using the Dicvol04 algorithm in HighScore Plus [1])was followed by a Le Bail [2] full pattern fit. Finally the results were printed automatically into an MS-Excel sheet.
Of the 160 scans, HighScore Plus automatically indexed 94. Most of the non-indexed scans stemmed from almost empty wells or wells containing amorphous material only.
Following the automated cell search, results were combined with the cluster analysis (Figure 2), a combination unique to HighScore Plus. The 3D PCA score plot on the left of Figure 2 shows non-indexed scans, represented as cubes. Indexed scans are displayed as spheres. Alternatively, cell volume data can be indicated in the PCA (Figure 3); the higher the volume, the larger the sphere. Many other properties can also be displayed in the score plot (see Figure 4, an HighScore Plus operator window).
Figure 2
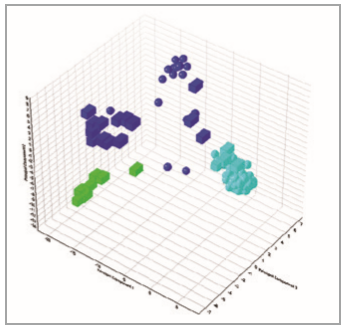
Figure 3
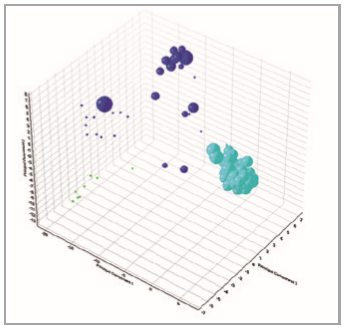
Figure 4
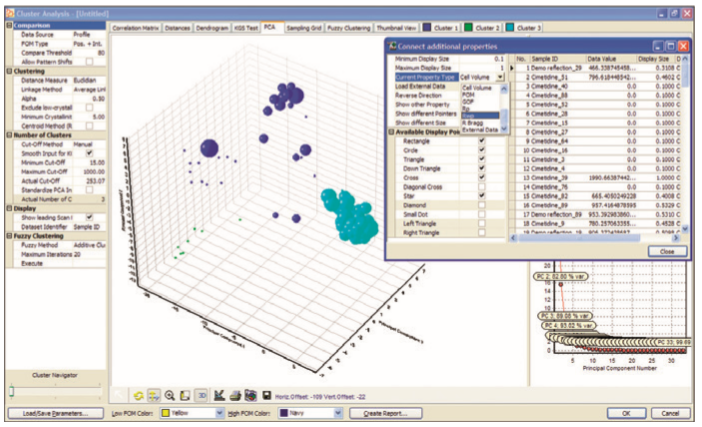
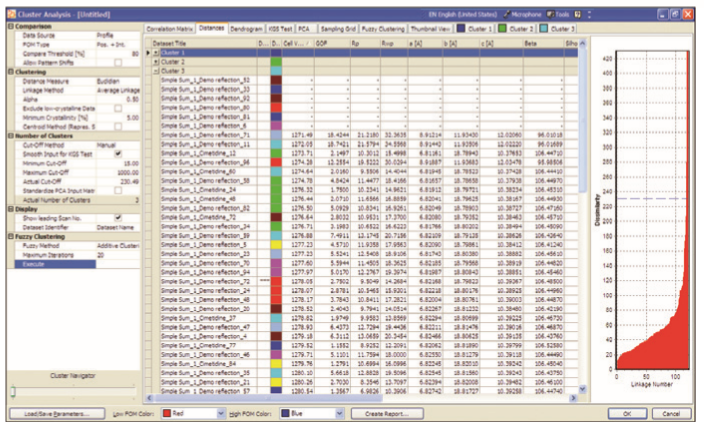
Figure 5 shows a HighScore Plus cluster screening window for the light blue cluster. The table confirms that most members of the light blue cluster were indexed with the cell parameters (known from the literature) of the most common (monoclinic) polymorph of cimetidine which had been used as the starting material. This indicates that these scans have been indexed correctly.
Figure 5
After splitting the very diverse dark blue cluster shown in Figure 1 into two new clusters (shown as dark and light blue in Figure 6), one indexed scan, which lies on the edge of the cluster, becomes visible. Since only this outlying scan could be indexed, it indicates that this cluster consists mainly of polymorphic mixtures.
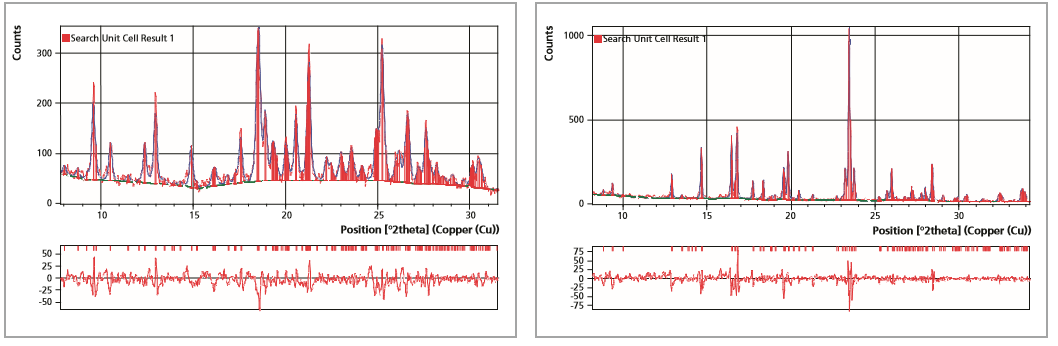
Its position at the edge of the cluster also explains why this scan could not be identified easily using cluster analysis alone. The one indexed scan from the light blue cluster in Figure 6, is displayed as a Le Bail full pattern fit in Figure 7a, together with a Le Bail fit of the representative scan (Figure 7b) of the red cluster (the most common cimetidine polymorph in this experiment). The quality of the fit is demonstrated by the good approximation of the red measured profile by the blue calculated profile, confirming the correctness of the cell search results.
Figure 6
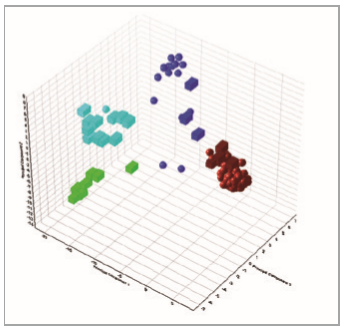
Figure 7
Characterization of pharmaceutical compounds and the analysis of complex formulations, together with an increasing need for data to support regulatory submissions, mean that the pharmaceutical industry now depends on a range of analytical techniques. XRPD has proved essential for many pharmaceutical applications because of its ability to non- destructively determine the crystallographic constitution of samples. The work described here demonstrates the effectiveness of the PANalytical diffractometer and HighScore Plus for high- resolution, high-throughput XRPD polymorph screening. A major advantage offered by the PANalytical system is that the data quality from the initial scans is so high that subsequent analysis can be conducted on the same data sets, with the same instrument. Traditionally, a screening instrument would first be required, and then another setup to create high- resolution data for indexing and full pattern fits. The PANalytical software package seamlessly combines clustering with crystallographic analysis.