Measuring and monitoring the theoretical plate number (TPN) of a Size Exclusion or Gel Permeation Chromatography (SEC/GPC) system can be required to meet for example regulatory demands or simply to monitor the system's performance.
The theoretical plate number is determined using a small molecule (e.g. ethyl benzene in THF) that can fully permeate any available pores within the SEC column. As this is different from the behavior of polymer molecules which can only penetrate a fraction of the pores, the TPN is not a good indicator for the polymer separation quality. A better measure for the separation power of a SEC system is the slope of a conventional calibration curve. As TPN determination is easy and quick, it can be used as one indicator to monitor the condition of an SEC system. A change in TPN for a given setup indicates that a change in the system's properties has occurred. Further investigation will be required in order to identify the reason for the TPN change and the impact on the system's performance.
The TPN is usually determined by using a small injection volume (e. g. 20 µL) of a relatively low concentration (application dependant) of a small molecule under otherwise unchanged conditions compared to a normal SEC measurement.
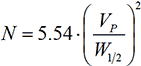
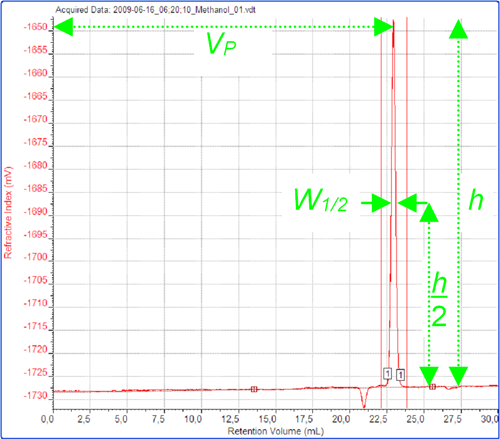
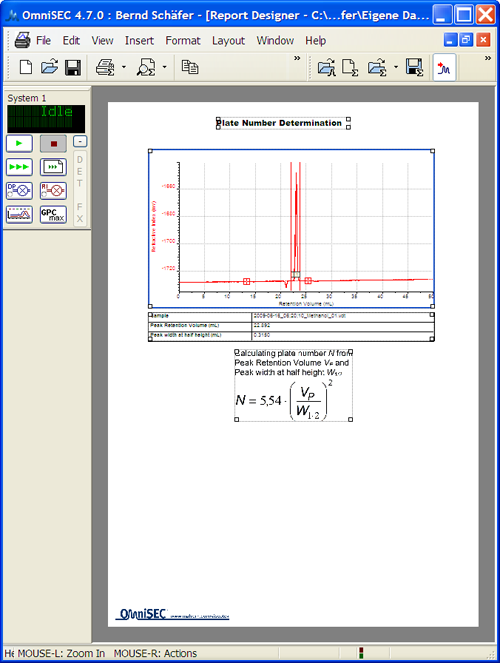
It is widely accepted to use the so- called half height procedure to determine the theoretical plate number N. This uses the peak elution volume VP of the sample and the width W1/2 of the signal peak at half of the maximum peak height. See the figure below for explanation. The formula for calculating N is:
|
The OmniSEC software assists in the TPN determination by giving the values both for VP and W1/2within the report designer. The values are available in OmniSEC 4.7 and later versions. If you use an older software version (check the Help menu, About OmniSEC… to find out), you should contact Malvern Instruments' Helpdesk to arrange to update to the latest version.
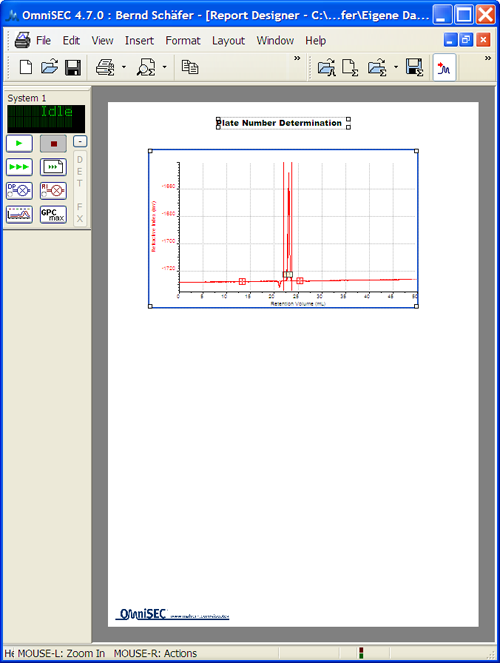
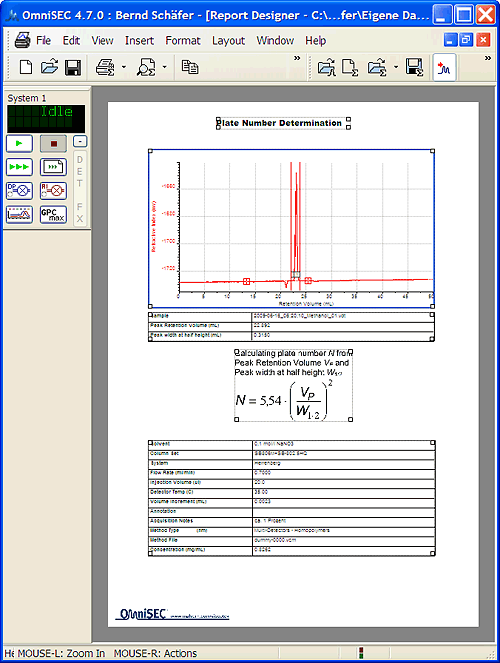
Run the sample you want to do the TPN determination with, set baselines and limits around the small molecule's peak:
|
Next, "calculate" the sample by pressing the ∑ symbol on the tool bar. Often no molecular mass will be reported for this type of very low molecular weight molecule; however, OmniSEC requires a working method to generate the information required for the TPN determination.
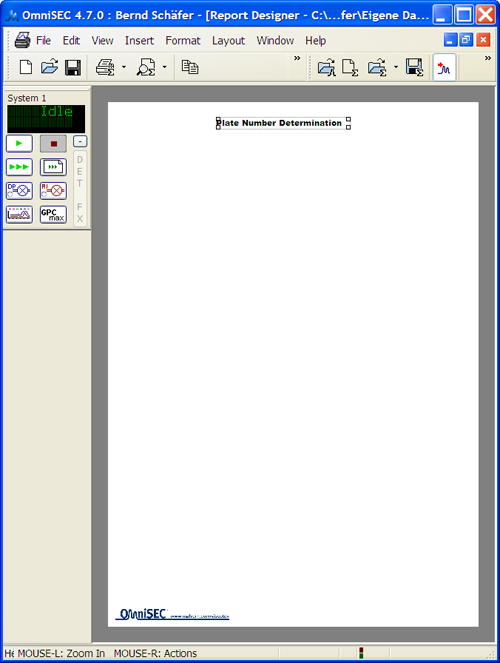
Start the Report designer from the Reporting menu. The report designer will start off with a blank page.

|
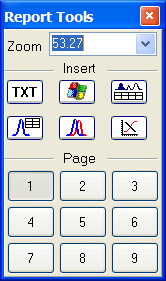
The Report Tools window offers the tools used to create the report.
|
For documentary purposes you might want to add some extra information on the page. Text can be added to the template by pressing the
 button and positioning the text box on the page. Once the text box has been dropped to the page, double-click it to edit the text. Right-clicking on the text box or selecting Font from the Format menu allows adjusting the typeface. Help for producing a tidy layout (e.g. aligning items) can be found in the Layout menu.
|
Next, a chromatogram can be added to the report using this button from the report tools:

Once the plot is placed on the page, the options are available from the context menu by right-clicking on the plot.
|
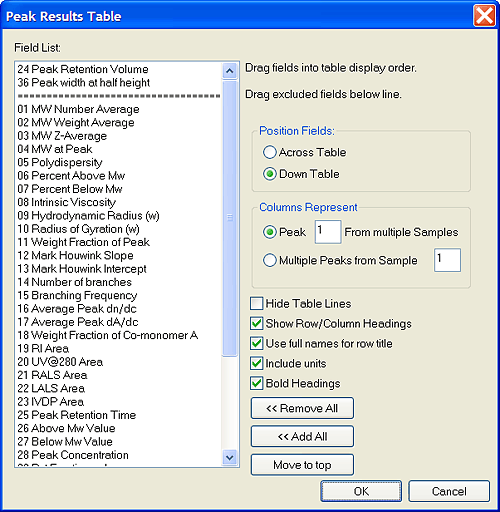
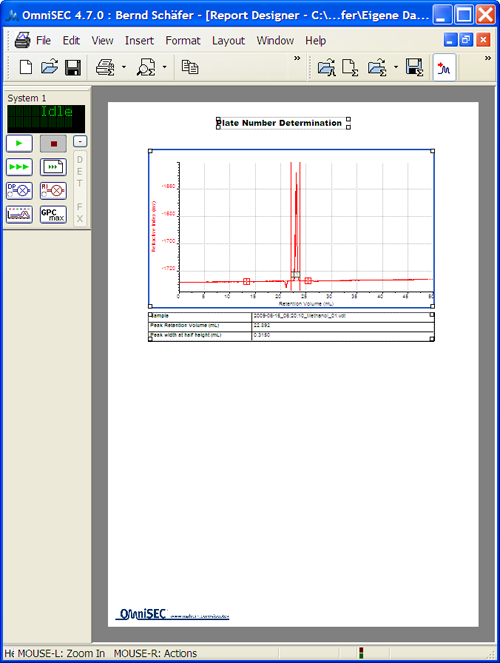
The numbers needed to calculate the TPN are in the peak results table:

After placing the peak results table, double click on it to select the appropriate values. These are numbered 24 Peak Retention Volume and 36 Peak width at half height.
|
The values that are moved above the double dashed line in this window will be plotted in the report. This plot will always contain the sample ID.
|
As an aide-memoire you could add the information on how to calculate the TPN. As the OmniSEC Report Designer has some limitations when it comes to very advanced layout options, the formula has to be inserted as a graphic which could be generated from a screenshot for example. To add a graphic to the report, use the
 button in the report tools window.
|
Further information, e.g. the column set used, solvent, flow rate, injection volume and much more can be found in the sample info table

Again, once it is placed on the page, double click on it to select the values important to you.
|
Now save this report template using the File menu Save for future use.
Of course, you can print the page you created directly from the report designer.
Once you have created and saved a report template, it can easily be re-used on new data.
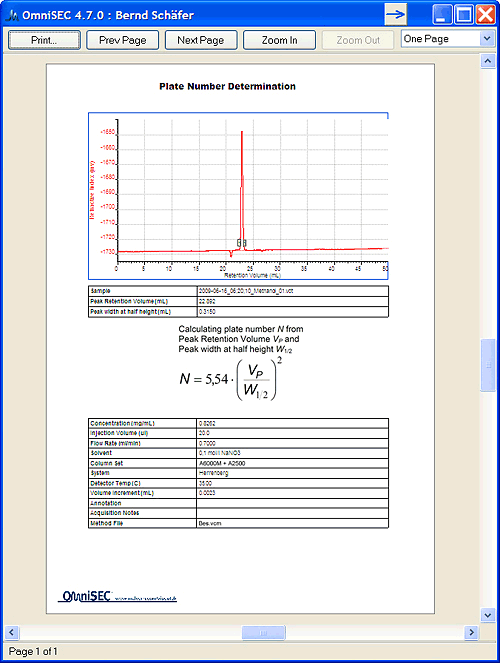
Simply, open the new data file, set baselines and limits and calculate it. Then select Use alternate Report Design from the Reporting menu to view or print the results. A file requester will open, select the report template and click the [Open] button.
This will open the preview or directly print the results. An example is shown below.
Now you have the Peak retention volume and the peak width at half height, simply use the formula from the first page to calculate the TPN.
|