To ensure that your NanoSight instrument is performing within specification, it is best practice to regularly measure size-traceable standards. The size standard/s used should be similar to the size of the nanoparticles which are typically measured with the instrument. Where multiple samples of different sizes are measured, standards representing the extremes should be measured. It is recommended that the size of standard/s be checked at least every size months.This protocol outlines how to measure size-traceable standards to check that your instrument is performing within specification.
The following represents the procedure for measuring NIST-traceable polystyrene latex (PSL) size standards with NanoSight instruments using NTA software (version 2.3 or later) and is applicable to all instruments within the range. While alternate suppliers offer similar products, these protocols were developed with Thermo Fisher Scientific’s 3000-series Nanosphere standards. The standards supplied with new NanoSight systems are pre-diluted 1:100 from the initial ~1% weight/volume in 18 MΩ deionized water containing 0.02% sodium azide, and are also available from Malvern Instruments using the following part as shown in Table 1.
Part no. | Description |
|---|---|
NTA4087 | 50nm Latex Standards 3mL |
NTA4088 | 100nm Latex Standards 3mL |
NTA4089 | 200nm Latex Standards 3mL |
NTA4091 | 400nm Latex Standards 3mL |
Prepare diluent solution of 0.02 µm filtered 10 mM KCl (see Diluent Section later in the document).
Rinse syringes to be used by filling syringe and discarding diluent solution three times. Rinse any sample containers three times.
Clean sample chamber surfaces directly using ethanol and a lens wipe or tissue.
Assemble sample chamber and rinse through with at least 5 mL of KCl solution.
Dilute the Malvern supplied standards according to Table 2 using 0.02 µm filtered 10 mM KCl. Take care to only insert the pipette tip 1-2mm below the meniscus of the stock when aspirating. Mix the diluted stock by gently inverting the vial 5 times.
Nominal size | Dilution factor |
|---|---|
50nm | 1000-2000x |
100nm | 700-1000x |
200nm | 100x |
400nm | 20x |
If using size standards from another source make an initial dilution to generate a 0.01% weight/volume stock and dilute as described above.
Load the sample chamber with the final dilution of the sample, taking care that no air bubbles are introduced.
Where available, use the AutoSetup function within the software to obtain the appropriate camera level and focus for the samples.
Alternatively, and for manual systems, adjust the camera level, focus and image position so the image is centered, particles are clearly visible, in focus and with under 30% particles being colored (indicates saturated pixels). Examples of poor and good particle light scatter images are shown in Figure 1.

Figure 1a Visual of a good image, and 1b a poor image of light scatter from particles visualized with the NanoSight instrument.
Using the SOP script function, collect a minimum of 3 repeat measures. The duration of each capture will depend on the number of particles visible in the field of view; 60 seconds are normally sufficient providing there are in the region of 20-60 particles in the field of view in any single frame. A minimum of 500 total particle tracks per measurement should be collected.
Ensure that the temperature in the cell is recorded automatically or measured and recorded (depending on instrument model).
The use of Advanced Analysis settings is not required.
Select an appropriate Detect Threshold setting to process the captured videos. The setting will be correct when each white dot that should be included as a particle is highlighted with a red + (Figure 2a). If the detection threshold setting is too high, the white particle dot will not contain a red cross and is not included in the data profile (Figure 2b). If the detection threshold setting is too low, there is potential that noise will be included in the data profile which is indicated as a blue cross in the image (Figure 2c).

Figure 2. Impact of changing detection threshold setting on sample analysis with NanoSight instruments with the light scatter from each particle is seen as a white dot. Each particle should be highlighted with a red + to indicate that the particle will be in included in the data set (a). If the Detection threshold setting is too high not all particles will contain the red + (b). If the setting is too low noise may be tracked and included in the data set, indicated by blue +’s (c).
Separately, test the diluent solution to ensure there is not a significant contribution from background particles in the diluent liquid. Significant here would be 3 or more particles visible in any one field of view at the same camera level as that chosen for particles being measured. Alternatively, if a concentration analysis reports a concentration of less than 0.3x10⁸ particles per mL, the result can be considered valid.
Mode size for all size standards measured under optimum conditions should be within 10% of the certified mean size and in most cases should be <4%. A typical size-distribution and data profile for 100nm NIST standards are shown in Figure 3.
Expected % CV for size data from 5 repeat 60 second measurements of NIST standards are shown in table 3. Expected repeatability for concentration measurements of 100nm NIST standards are shown in Table 4.
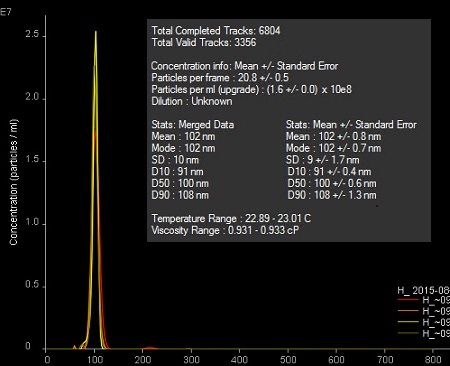
Figure 3. Typical size distribution and data profile from NIST 100nm polystyrene latex standards and associated data summary. 4 repeat measures of 60 seconds were taken.
Nominal size | Measured variation (coefficient of variance) |
|---|---|
50nm | 1.83% |
100nm | 1.70% |
200nm | 1.85% |
400nm | 1.54% |
Concentration
| Measured variation (coefficient of variance) |
|---|---|
0.86 | 4.10% |
8.60 | 3.95% |
17.0 | 2.81% |
Although there is little to cause a drift in measurement accuracy, it is good practice to test standards on a regular basis, at least every six months to establish a baseline value for future tests.
As the technique measures hydrodynamic diameter, the use of pure water (HPLC or 18 MΩ/cm semiconductor-grade water) which does not contain any ions, will include a small but possibly significant bound double-layer of water with the particle. The inclusion of a small amount of salt will collapse this double layer and yield size results in line with those measured by electron microscopy as used for the certification of size. Tetrasodium pyrophosphate or tap water, filtered for particles, may be preferable for these reasons to ultra-pure water unless consideration is given for the slightly larger than certified size results.
If all sizes are lower than expected by an increasing percentage with size, vibration is likely to be an issue. The additional motion caused by vibration will be interpreted as a greater amount of Brownian motion, which corresponds to smaller sizes. While NTA can compensate for this up to some level, if the level is excessive, anti-vibration measures or relocation may be necessary.
If one size standard is outside of specification, it is recommended to test standards of different sizes to identify the source of the error.
All NanoSight instruments are factory set for accurate sizing data. Provided the instrument is used as stated in the user manuals errors in size should not occur. However, excessive shock or changes in any physical condition might affect the accuracy of the instrument. If this is suspected contact the Malvern helpdesk at helpdesk@malvernpanalytical.com or for US users, support.us@malvernpanalytical.com for assistance. It will be helpful to include a data report file and associated compressed sample video.