Four different polymers are analyzed by GPC/SEC to investigate the effect of molecular weight, dispersity and molecular structure on the final properties of the polymer.
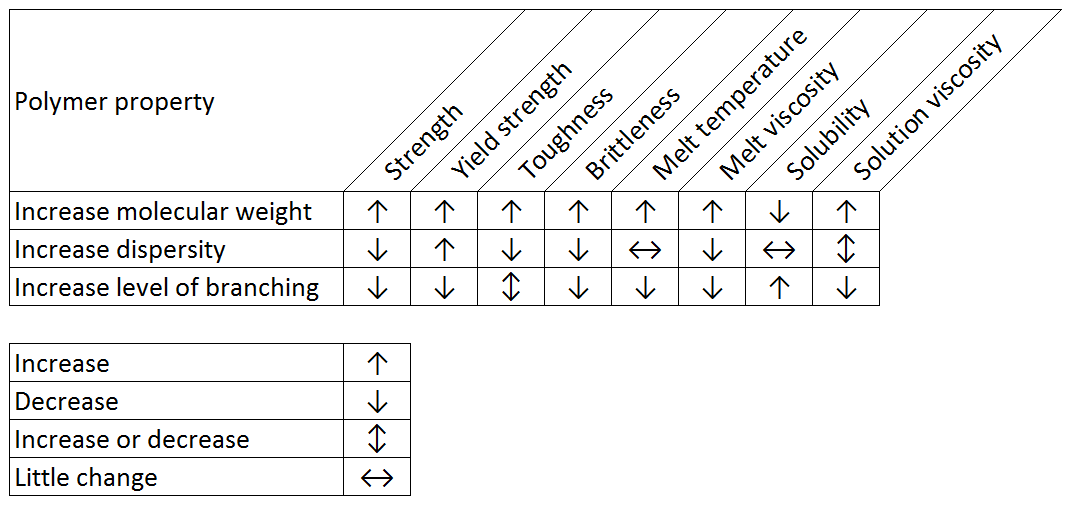
Polymer scientists are continually striving to manufacture products which have the correct characteristics for a given application. By controlling the molecular weight, branching and chemistry, they can tailor a polymer’s properties for a range of applications from containers and fittings to viscosity modifiers and drug delivery vehicles. The challenge here is that the physical properties and behavior of polymer products depend strongly on the properties of the polymer molecules themselves. This is also the case for finished products made from or containing polymers. For example, Table 1 shows how changing properties such as molecular weight, dispersity and branching can affect the bulk properties of a polymer. These are general trends and the actual effect will depend on the specific polymer.
|
An essential tool for investigating the molecular weight and molecular weight distribution, molecular size, intrinsic viscosity and structure of synthetic polymers, which all affect how the polymer material will behave, is gel permeation or size exclusion chromatography (GPC/SEC).
The principle of GPC/SEC involves separating the sample as it travels through a porous but inert chromatography column matrix. While smaller molecules penetrate the pores more deeply, larger molecules are excluded and thus travel through the column faster. The result is a separation based on hydrodynamic volume. A conventional GPC/SEC system setup, consisting of only an isocratic pump and a Refractive Index (RI) or Ultraviolet (UV) detector provides only a concentration profile of the size-separated sample. As such, any molecular weight measured where the sample and standard are different will only be relative and incorrect. They will also be subject to variation between system and setup, site and columns. This information can only ever be used comparatively at best. With multiple detectors that provide light scattering (LS) and intrinsic viscosity (IV) data, valuable additional information about a sample can be determined simultaneously.
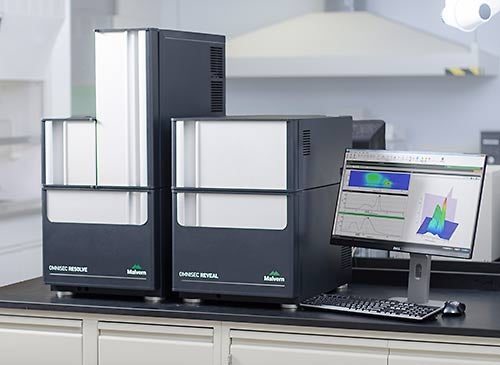
Plotting the molecular weight (MW) directly measured from the light scattering detector against the IV directly measured from the viscometer detector produces a Mark-Houwink plot to illustrate the relationship between molecular structure and molecular weight. In this application note, the structural distributions of some common polymers are compared using the Mark-Houwink (M-H) plot. The data are all generated using the Malvern OMNISEC system shown in Figure 1.
|
Samples were separated using two Viscotek T6000M columns. The mobile phase was THF stabilized with 300 ppm BHT. Samples were allowed to dissolve overnight to ensure full dissolution. The OMNISEC system was set up as follows:
Flow rate: 1.0 mL/min
Autosampler temperature: 15°C
Column oven temperature: 35°C
Detectors temperature: 35°C
All system control, data acquisition, data analysis and data reporting were performed using the OMNISEC software (v10 or later).
The four samples analyzed in this note are all broad distribution synthetic polymers: polystyrene (PS), polymethylmethacrylate (PMMA), polycarbonate (PC), polyvinylchloride (PVC).
An overlay of duplicate RI chromatograms for each of the four samples with their respective measured molecular weights is shown in Figure 2, while overlays of the molecular weight distributions can be seen in Figure 3. The differences in elution volumes and in the molecular weights at the same retention volumes can clearly be seen. This shows how the different samples, each with their different structures, elute at different time points for a given molecular weight. Light scattering based measurements of molecular weight are immune to these differences, therefore the measured molecular weights are accurate regardless of the structural differences.
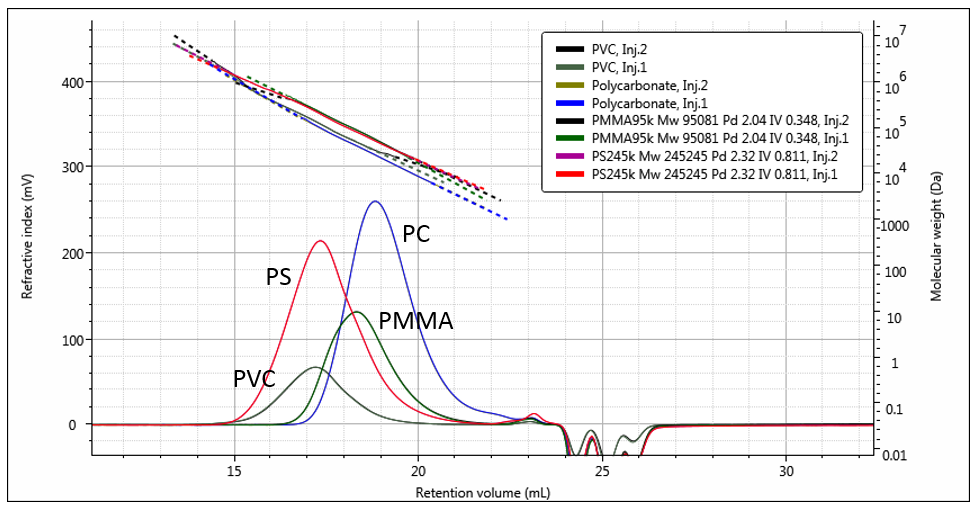
Figure 2: Overlaid duplicate RI chromatograms of the four polymers with their measured molecular weights.
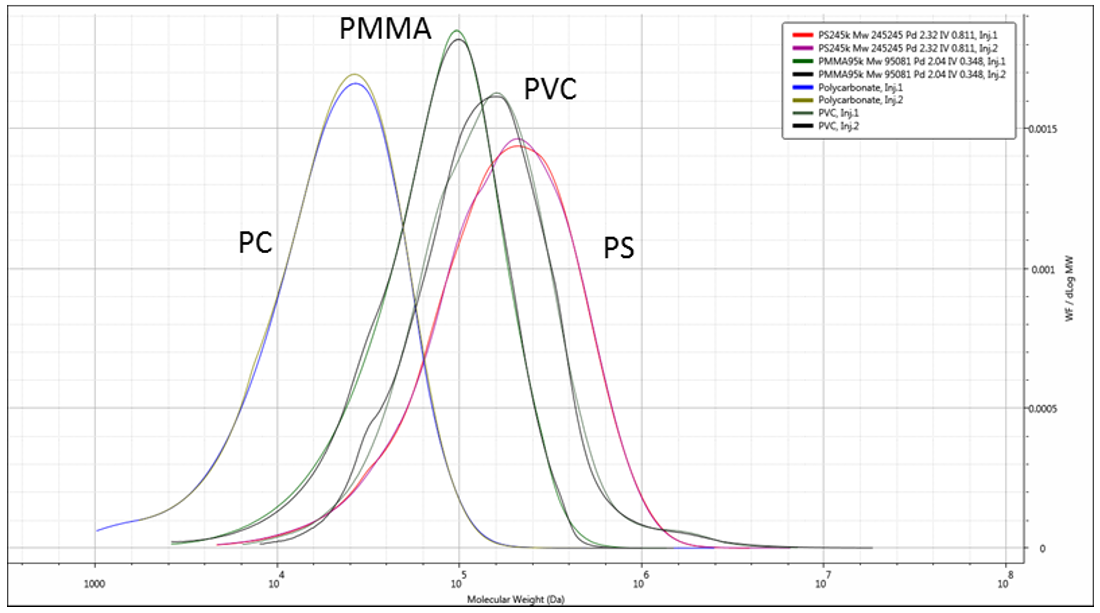
Figure 3: Overlaid duplicate molecular weight distributions of the four polymers.
Table 2 gives the calculated data for the samples showing the absolute molecular weights calculated directly from the Right Angle Light Scattering (RALS) and Low Angle Light Scattering (LALS) detectors.
| Parameter | Samples | |||
|---|---|---|---|---|
| PVC | PS | PMMA | PC | |
| Retention volume (mL) | 17.22 | 17.36 | 18.34 | 18.85 |
| Mn (g/mol) | 90,290 | 102,300 | 48,640 | 12,630 |
| Mw (g/mol) | 205,900 | 250,000 | 99,680 | 27,390 |
| Mz (g/mol) | 599,500 | 452,700 | 158,100 | 44,870 |
| Mw/Mn | 2.280 | 2.443 | 2.049 | 2.169 |
| IVw (dL/g) | 1.322 | 0.8168 | 0.3210 | 0.4781 |
| Rhw (nm) | 15.10 | 13.90 | 7.603 | 5.627 |
| M-H a | 0.6105 | 0.6822 | 0.6373 | 0.6667 |
| M-H log K (dL/g) | -3.066 | -3.740 | -3.655 | -3.252 |
We can see that the system gives values for the measured IV and hydrodynamic radius (Rh), as well as other parameters including the average M-H a and log k. The M-H a and log k parameters define the slope and the intercept on the Mark-Houwink plot. The slope, a, relates to the molecular structure while the log k value is indicative of the overall density. From this we can clearly see the differences between the polymer types, with for example the PVC having the highest IVw value but only the second highest Mw value. However, looking at the molecular weight distributions and average values for broad polymers does not always give a complete picture so it is better to look at the structure across the whole MW distribution using the M-H plot.
The M-H plot of all four polymers together (Figure 4) clearly shows the structural differences, with PMMA lowest on the plot, indicating it has the highest density in solution. Both PVC and PC have a lower density than polystyrene but although the average M-H a values are similar we can see there are some subtle differences, showing that in fact the PC has the most open structure (lowest density) across most of its distribution. The other feature that only becomes clear when viewing the M-H plot is that the higher molecular weight material in the PVC sample has a different slope on the M-H plot. This almost certainly indicates the presence of some branched material that may not otherwise have been identified. The presence of these types of minor differences or contaminants in polymer samples is exactly the kind of minor modification which multi-detector GPC/SEC can identify that was previously invisible to conventional systems. This allows for finer control of polymer production and therefore, its final properties.
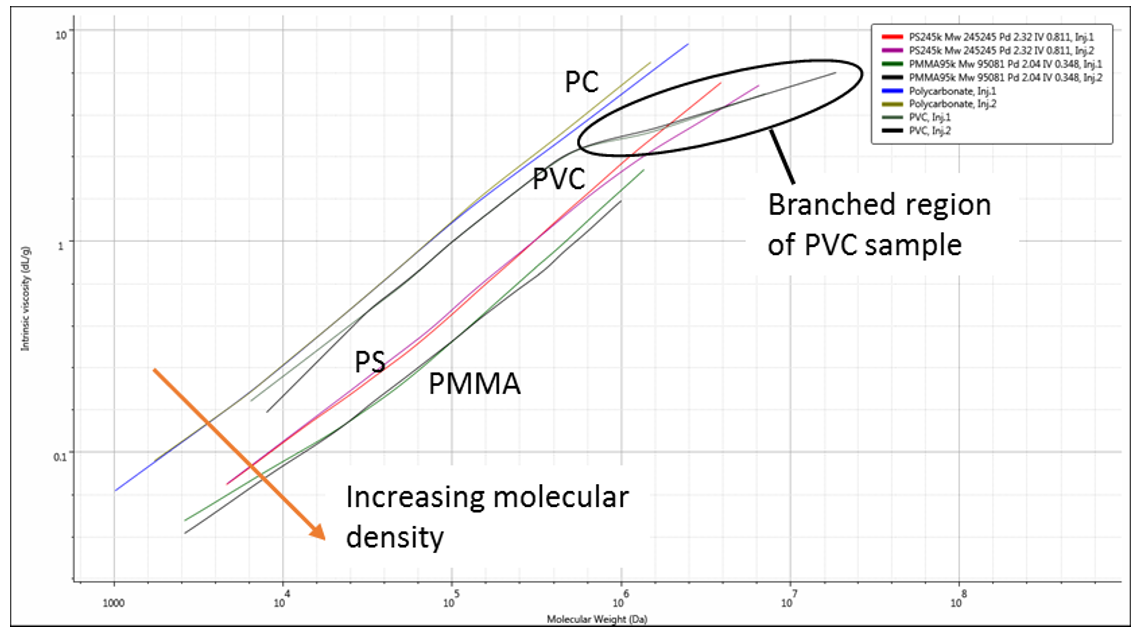
Figure 4: Mark-Houwink overlay of all four polymer samples showing the structural differences.
In traditional or conventional GPC/SEC, the calibration based on polystyrene standards would yield entirely the wrong molecular weight values for all three of the other polymers (see MW plots in Figure 2). Furthermore, even if a linear ‘Mark-Houwink’ correction was applied, the non-linear nature of the M-H relationships clearly shown in Figure 4 would still lead to substantial errors in the results.
The OMNISEC platform provides high quality, information rich polymer GPC/SEC data. These four common polymers are easily characterized. The absolute MW from the highly sensitive LS detector combined with the IV data provided by the newly designed viscometer allow simple access to the powerful M-H plot in greater detail than ever before. The data this plot delivers is of utmost importance to all polymer chemists who want to understand polymer differences or trends in terms of molecular weight and structural changes independently from each other.
By controlling the level of branching, or substitution of a polymer, scientists and manufacturers can produce polymers that are optimally placed on a Mark-Houwink plot for their given application. In doing so, they can control the physical properties of their materials with greater precision. The result of this improved control is higher quality and a higher value product with fewer production failures. In research, it means more successful syntheses, greatly improved data quality and faster publication.