Block copolymers are composed of two or more block of polymerized monomers. They are widely used premium polymers. Two of the most common block copolymers are styrene-butadiene-styrene (SBS) and styrene-isoprene-styrene (SIS). These block copolymers are formed by linking polystyrene block with polybutadiene block or polyisoprene block and again with polystyrene block. SBS or SIS block copolymers are generally marketed as premium elastomeric products. These materials are broadly applicable and are commonly found in automotive and appliance parts, road and roofing materials, motor oil formulations, adhesives, sealants and coatings etc.
|
Sample ID |
Mw (Da) |
SD (Da) |
IVw (dL/g) |
SD (dL/g) |
|---|---|---|---|---|
|
HMW-S |
313,400 |
900 |
1.714 |
0.003 |
|
HMW-L |
310,000 |
900 |
1.716 |
0.003 |
|
MMW-S |
155,500 |
700 |
1.056 |
0.003 |
|
MMW-L |
156,000 |
300 |
1.061 |
0.002 |
|
LMW-S |
78,000 |
200 |
0.756 |
0.002 |
|
LMW-L |
76,400 |
200 |
0.709 |
0.001 |
Historically, molecular weight distribution (MWD) characterization of block copolymers is carried out using conventional GPC systems which are capable of resolving the species formed during a multi-step synthesis. The peak MW and peak areas of the resolved species provide empirical correlations to the properties and performance of the materials. However, convention GPC methods measure relative peak MW and peak areas that are easily influenced by the effective resolution and relative concentrations of the components. The FIPA method described below provides an alternative chromatographic method that is more accurate, precise, rapid and easier to use, particularly in a plant environment.
For the front end of the chromatography system, a Viscotek GPCmax combination of degasser, pump, and autosampler was used. The detection was made on a Triple Detection Array (TDA) system. The detectors in series were the light scattering (LS), the differential refractometer (RI) and the viscometer (DP). The eluent used was tetrahydrofuran (THF) at a flow rate of 1.5 mL/min. The separation of the polymer and the solvent was made on a ViscoGEL column FIPA-100H. The samples were diluted at 2 mg/ml and a volume of 100 μL was injected.
Sets of block polymers were obtained at low, medium and high molecular weight. The solid finish product (S) and the liquid process cement sample (L) were studied for the 3 molecular weight ranges.
|
|
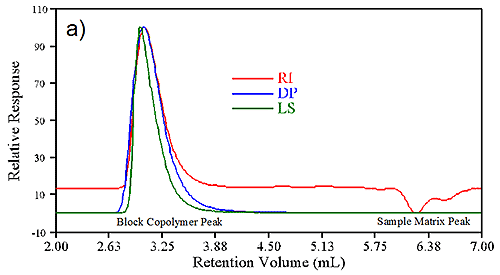
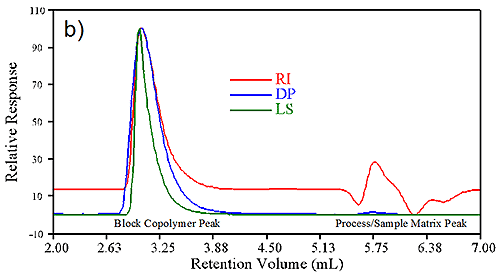
For flow injection polymer analysis, the sample is separated from the solvent in which it was diluted but there is no separation of the sample itself (Figure 1). The whole sample is analyzed as an integrated peak. The peaks elute in about 3 mL. Since there is no separation, FIPA provides the weight average molecular weight (MW) of the sample through the light scattering detector and the weight average intrinsic viscosity (IVW) of the sample. Table 1 reports the average molecular weights and average intrinsic viscosities for the 6 samples. The standard deviation is also given for the 4 injections of each sample. Excellent repeatability of these FIPA runs is observed. The results for the HMW and MMW samples were correlating well between the L and the S samples. Variability between the solid and liquid samples is within statistical limits, however, the somewhat wider spread of the L values between the solid and liquid samples may be worthy of further evaluation. Post reactor gain in MW and IV may be due to incomplete quenching or cross-linking reactions, which are not desirable for precise control of product properties and performance.
|
Sample ID |
% Polymer |
SD |
SD (dL/g) |
|---|---|---|---|
|
HMW-S |
100 |
- |
- |
|
HMW-L |
22.1 |
0.02 |
0.08 |
|
MMW-S |
100 |
- |
- |
|
MMW-L |
28.6 |
0.02 |
0.07 |
|
LMW-S |
100 |
- |
- |
|
LMW-L |
24.2 |
0.04 |
0.16 |
In addition to the molecular weight measurements shown above, FIPA can also provide simultaneously the percentage of polymer composing the solution. Table 2 shows the results for the polymer composition. To make this measurement, the RI detector is calibrated with the finished product in order to obtain a value of dn/dc and then the samples were measured. The following table is a tabulation of the % Polymer for the three process cement samples. For illustration purpose, we assigned a value of 100% polymer for the solid samples. In actual plant application, this value can be adjusted to a true % polymer basis, i.e., accounting for insoluble matters and moisture etc.
We note also an excellent precision of this measurement. The average RSD for the three samples is about 0.1% which is more than an order of magnitude better than traditional "Dry & Weigh" methods.
In conclusion, FIPA is a fast, precise and accurate analytical tool for routine process and quality control. This technique provides quick and easy simultaneous measurements of MW, IVW, and % polymer for liquid process samples in less than 5 minutes. This FIPA technology is particularly useful for a premium product because of performance and uniformity requirements. Furthermore, quick process feedback can help reduce off specification material and improve capacity.