
The combination of Dynamic Light Scattering (DLS) with Raman Spectroscopy provides the capability to investigate a wealth of chemical, structural, and physical parameters about biotherapeutic proteins under formulation conditions.
Here, we demonstrate that by simultaneously monitoring both the colloidal (DLS) and conformational (Raman) stability of a template monoclonal antibody (mAb) and a modified monoclonal antibody (mmAb) provides significant insights into the mechanistic effects of thermal stress on the mAb and the mmAb.
In particular, this combined DLS/Raman technique has revealed that the lower thermal stability (early oligomerization) of the mmAb compared to the template mAb, is initiated by a tertiary structural change in a tyrosine side chain residue; a mechanistic observation that could not have been revealed fully by the separate use of these techniques.
In developing biopharmaceutical products, characterizing thermal stability is an important step in the process of learning about and optimizing monoclonal antibodies (mAbs) and their formulations. Differential Scanning Calorimetry (DSC) is the standard technique used to characterize thermal behavior, providing an endotherm from which one can derive stability and thermodynamic properties. In order to minimize aggregation during heating, DSC samples are run at low concentrations (0.5 mg/mL -1.0 mg/mL) and the technique therefore is not effective at testing the stability of higher concentrations that are typical of formulated products. Also, although the assumption is that no aggregation occurs as a result of heating these low concentration samples, there is no way to confirm this from the data obtained, and samples with visual evidence of aggregation are often the end product of a DSC run. The combination of DLS (to characterize size and aggregation) with Raman spectroscopy (to provide insights into the secondary and tertiary structural changes which are occurring) enables the study of thermal stability at formulation concentrations (and with excipients), and furthermore is able to differentiate unfolding from aggregation events.
In contrast to globular proteins studied previously (see Inform White Papers on use of DSL/Raman to characterize BSA and Lysozyme) in which secondary structure changes induced by thermal stress are quite significant, the secondary structure in mAbs is known to be quite stable. This is due to the fact that the structural framework is rich in β-sheet, with covalent disulfide bonds providing additional stability. Thermal stress alone is not anticipated to significantly perturb secondary structure.
In the case study presented in this White Paper, we compare the thermal stability of a mAb that has been structurally modified (i.e. a modified monoclonal antibody or mmAb) and the corresponding template monoclonal antibody, or the mAb upon which the modification has been performed.
Malvern Instruments’ Zetasizer Helix (ZS Helix) integrates a fiber-coupled Raman spectrometer with a Zetasizer Nano ZSP to provide DLS (colloidal stability) and Raman (conformational stability) data sequentially on a single sample. The Zetasizer Nano system integrates proprietary non-invasive backscatter (NIBS) detector technology with dynamic (DLS), static (SLS) and electrophoretic (ELS) light scattering to measure the hydrodynamic radius of proteins from 0.15 nm - 5 µm, from 0.1 mg/mL to ≥ 100 mg/mL. Raman spectra are collected using 785 nm excitation (~280 mW) from 150 cm-1 - 1925 cm-1 at 4 cm-1 resolution. The mAb and modified mAb (mmAb) were provided at 50 mg/mL in 10 mM His buffer at pH 5.5. The samples were stored at 4 °C until the studies were conducted. Sample aliquots (~120 µL) were placed into a 3 mm quartz cuvette and positioned in a compartment providing temperature control from 0°C - 90°C ± 0.1°C. Thermal ramp studies were conducted by collecting Raman and DLS data over a series of pre-defined 0.1°C - 5°C step-wise increments. Isothermal incubation studies were conducted by collecting a series of Raman and DLS data over a predefined time interval at the desired temperature set-point.
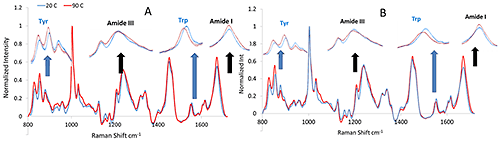
The mAb and mmAb samples were heated, and size and structural characteristics monitored via DLS and Raman throughout the experiment. Figure 1 shows the Raman spectra of both the mAb and mmAb at low and high temperature, and confirms the stability of the secondary structure of the molecules. Spectral regions corresponding to these conformations, specifically the Amide I and III regions, do not show significant peak shift or intensity changes, and only slight band broadening, mostly in the Amide I region.
|
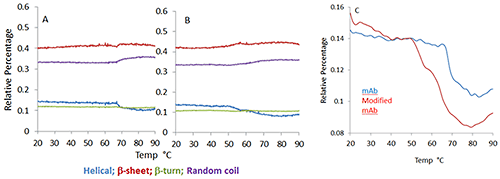
The secondary structure of mAb/mmAb can be modeled with a Partial Least Squares analysis in which spectra obtained from reference protein samples with known secondary structural elements are used to predict the secondary structure of unknown protein samples. Figure 2 shows the temperature dependence of the four structural motifs predicted by the model (i.e. α-helix, β-sheet, β-turn, and random coil) for the mAb (Figure 1A) and mmAb (Figure 1B). Despite the relatively small spectral (Figure 1) and structural (Figure 2) changes observed (e.g. the helical structure shows <10% structural change for both the mAb and mmAb, compared to ~40% reduction in the helical structural content observed for BSA on heating over its transition temperature), it remains possible to discern that the mAb and mmAb exhibit different behaviors (Figure 2).
In Figure 2C, the mAb shows a single abrupt transition close to 70°C, while the mmAb shows a lower onset temperature with a double transition at ~50°C and 65°C, respectively. This indicates that the mAb and mmAb respond differently to thermal stress, even though this was not obvious in a direct comparison of the spectra.
|
|
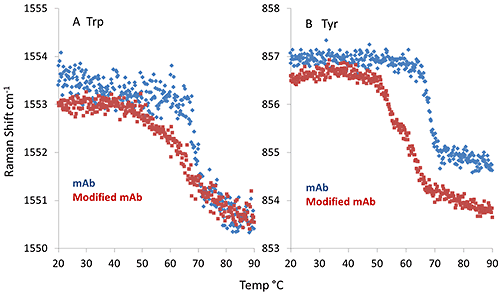
Interestingly, the thermal profile of the aromatic side chain markers, i.e. tryptophan (Trp) and tyrosine (Tyr), show significant differences between mAb and mmAb. As shown in Figure 3A, the spectral marker indicative of the dihedral angle between the indole ring and peptide bond plane of the Trp side chain (feature at 1550 cm-1) show a single, sharp transition for the mAb at ~69°C, while the mmAb has an earlier onset, ~66°C, and its transition is quite broad. Further differences are noted in Figure 3B, in which the spectral marker describing the hydrogen bonding environment of the Tyr side chain is plotted. Again, the mAb exhibits a single, sharp transition at ~69 °C. However, the mmAb trace shows a double transition, with inflection points at ~53°C and ~62°C. This observation, along with the conformational stability seen in the secondary structure, suggests that the Tyr side chain (added as part of the modification), might trigger an early conformational change leading to lower thermal stability.
Raman spectroscopy reveals structural changes, but does not address size changes induced by unfolding and aggregation during thermal stress. The combination of DLS and Raman enables us to analyze both of these important characteristics simultaneously.
|
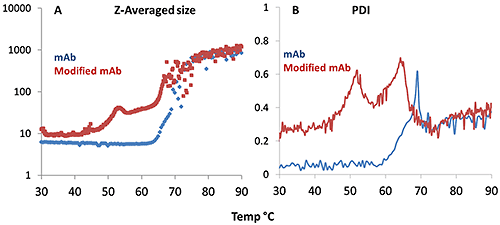
Figure 4A demonstrates that the aggregation onset for the mAb occurs at a higher temperature than for the mmAb, again demonstrating its high thermal stability. The mmAb exhibits the same double transition as seen in the Raman data, specifically for the tyrosine H-bonding environment. The DLS Z-average size data shows that the lower temperature transition is an oligomerization event at ~50°C. The higher temperature transition for the mmAb (~65°C) is a rapid and major aggregation event, as seen in the mAb sample >70°C. The PDI trend, shown in Figure 4B, is consistent. For the mAb sample, the PDI fluctuates around 0.1 until a single significant increase is seen at ~60°C. The PDI evolution for the mmAb sample shows two peaks at ~50°C and ~62°C, indicating transitions from a relatively homogeneous size distribution to a polydispersed distribution, and then dropping back to relatively homogeneous before finally becoming quite polydispersed again. This suggests that the mmAb samples form oligomers during the first transition, and that these oligomers then form the large aggregates indicated in the second transition.
All of these observations are consistent with the Raman data presented above. Furthermore, if we consider the early onset of the single Trp transition and the double transition of Tyr, the Raman and DLS data taken together indicate that the lower thermal stability (early oligomerization) that is characteristic of the mmAb may be triggered by a tertiary structural change in the tyrosine side chain.
|
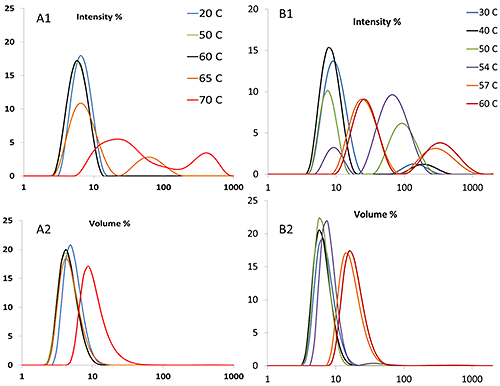
DLS determines not only size itself, but also size distribution, which is not obtainable using static light scattering or turbidity measurements. Figure 5A1 illustrates that for the mAb, a peak of ~100 nm appears at ~65°C, while for the mmAb (Figure 5B1), a population of particles with this size is present at ~50°C. It should be noted that due to the extreme sensitivity of DLS, the presence of 0.1% (by volume) large aggregates will generate the equivalent scattering intensity as 99.9% of particles 1/10th of their size. Therefore, the transition temperature derived from the volume weighted distribution is higher than the same value derived from an intensity weighted distribution. For the mAb, the volume distribution shows a clear increase at ~70°C (Figure 5A2), while for the mmAb, the peak shifts to ~57°C (Figure 5B2).
The PDI appears to be the metric which is most sensitive to aggregation, compared to Z-averaged size and volume distributions. In Figure 4B, the aggregation onset temperature from Z-averaged size is ~65 °C, but analysis of the PDI puts the onset temperature as low as ~60 °C.
It is important to note that the determination of hydrodynamic size from dynamic light scattering is based on the Stokes-Einstein equation, which requires the solution viscosity to be known. At relatively low concentrations, ~5% by weight, using the viscosity of water to approximate that of the solution is reasonable. That said, once the protein is aggregated, precipitated, or gelled, this approximation is most likely no longer valid. Under such circumstances, the size values derived are probably not precise, but it can be assumed that the trends they exhibit are qualitatively correct.
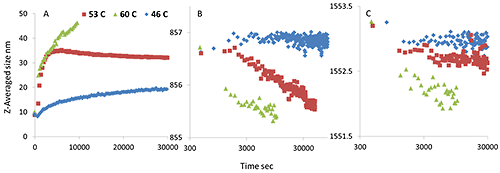
The above results strongly indicate that the differences in the thermal stability profiles of the mAb and mmAb are due to oligomerization of mmAb, driven by tertiary structure (side chain) unfolding. However, what is not clear is the kinetics of this process and how stable the oligomers are. Further experiments to investigate the kinetics of oligomerization of the mmAb were conducted. Specifically, isothermal incubations at pre-transition (46°C), in-transition (53°C) and post transition (60°C) temperature were conducted. The results are shown in Figure 6.
|
Incubated at the pre-transition temperature, 46°C, the size slowly increases, and neither the Trp nor Tyr Raman maker bands show significant peak shifts. At 53°C, however, the size quickly increases from 10 nm to ~35 nm and then stabilizes. Concurrently, the Tyr peak position drops, while the Trp peak position shifts slightly. More specifically, the Tyr peak position shifts from 856.8 cm-1 to 855.5 cm-1, the value seen for the first transition in Figure 3B. At 60°C, the size quickly increases to over 40 nm within 3 hours, and both Trp and Tyr peak positions quickly shift lower, and again the Tyr peak position shifts to ~855.5 cm-1 .
These observations further support the suggestion that the newly added or modified tyrosine residues trigger oligomer formation at lower temperature, which leads ultimately to lower thermal stability for the modified monoclonal antibody. Even more interestingly, on returning to the starting temperature after the isothermal incubation, the Tyr peak position remains lowered, but the peak position of the Trp reverts to some extent (data not shown).
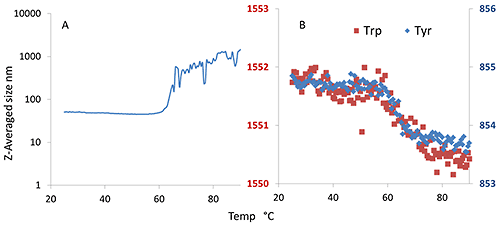
As mentioned above, the final peak position of Tyr following the 53°C incubation is close to that seen after the first transition has occurred during the thermal ramping experiment, shown in Figure 3B. Therefore, we stopped the incubation at 60 °C, considering the first transition completed, and cooled to 20 °C to test the thermal reversibility of the oligomers.
|
In Figure 7A, the initial size is ~50 nm and remains as such until the final aggregation onset close to 64°C. Trp and Tyr do not exhibit the characteristic double transitions, just a single transition at ~64°C, as was seen for the size transition. This indicates that the oligomers formed at ~50°C are stable and do not dissociate by cooling. Dilution experiments (data not shown) also indicate that the oligomerization is not completely reversible.
By combining DLS and Raman spectroscopy, we have clearly demonstrated the following points: 1) the tested monoclonal antibodies have different secondary structure transition profiles compared to model globular proteins; 2) aromatic side chain residues in the mAbs show clear conformational/structural transitions with thermal stress; 3) the thermal stability of the modified mAb is lower than the mAb, evidenced by the formation of oligomers at ~53°C; 4) the mechanism of oligomer formation appears to be driven by a change in the tyrosine side chain; 5) the oligomers formed are stable, and not reversible by cooling or diluting.
We note that: 1) multiple DLS-derived parameters can be used, i.e. Z-averaged size, PDI, size distribution, but that PDI may be the most sensitive to the changes seen; 2) size values need to be carefully interpreted if the solution viscosity changes significantly from that of water; 3) Raman spectral markers are sensitive enough to pick up multiple transitions even when the changes seen are quite subtle. These experiments have all been replicated with reasonable reproducibility.
Malvern Instruments' Bioscience Development Initiative (BDI) was established to accelerate innovation, development and the promotion of new technologies, products and capabilities to address unmet measurement needs in the biosciences market.