Across the pharmaceutical, food and chemical industries, granulation processes are used to convert light, fine powders into larger, more dense granules, to make fast-dissolving drinks, optimized blends for compression tableting and granules for waste water absorption applications, for example. Also in the manufacture of catalysts. Whether granulation is dry or wet the goal is to produce granules that fulfill the requirements of subsequent processing steps or end use. Particle size is often a defining characteristic.
This paper considers various granulation processes and the use of real-time particle size measurement in their optimization, focusing on two different sizing methods: laser diffraction and the spatial filter technique (SFT). Case studies illustrate the potential benefits associated with continuous particle size measurement.
Handling fine powders can be problematic, with materials in the sub-10 micron range being especially challenging. The strong forces of attraction between fine particles lead to high cohesivity and poor flowability, compromising efficient manufacture and use. From the point of view of safety such materials can also present a significant dust hazard.
The granulation of fine powders, alone or in a blend, tackles these issues, potentially eliminating any dust hazard, improving flowability and enabling the close control of:
Granulation of a blend can also help to prevent segregation thereby ensuring product uniformity.
The production of tablets within the pharmaceutical industry is a primary application that exemplifies the use of granulation. In tablet formulations the active ingredient, as well as being fine and cohesive, may be present only in extremely low concentrations. Physical dissimilarity between active and other constituents of the tablet is also a common problem, one that tends to promote segregation. Successful tablet production at the rates achievable with modern presses calls for a highly fluid blend that compresses rapidly to form a stable tablet. Granulating the active, alone or in combination with the excipients, is one way to produce a uniform feed that meets this specification, from an otherwise difficult formulation.
The process of granulation involves inducing otherwise discrete particles to cohere to form a stable, larger granule. Certain materials can, and should, be granulated in the dry state; for others wet granulation is preferable. Which technique is adopted depends on the properties of the primary particles and the granulation aims.
Where appropriate, dry granulation is arguably the simplest option.Compaction methods are especially valuable for moisture-sensitive materials and/or those that are susceptible to heat. Dry processing enables the close control of granulate density but equipment costs can be quite high and it can be relatively difficult to engineer a truly successful process. In contrast, wet granulation tends to result in a product with a lower fines content and a higher, but less well-controlled, granule density.
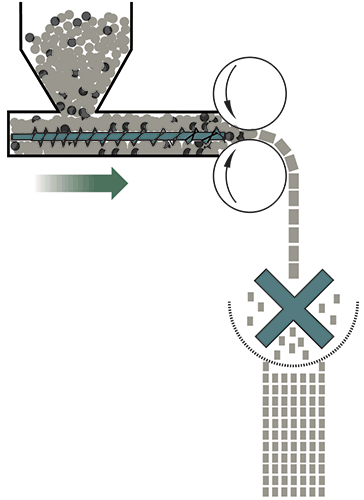
In dry compaction, the feed blend is fed downwards at a controlled rate between two counter-rotating rollers which apply pressure to compress the powder into dense ribbons or sheets. These are then chipped, milled and/or screened to produce granules of the required particle size distribution. With wet granulation on the other hand, particle agglomeration is encouraged through the introduction of a water- or solvent-based binding solution. High shear and fluidized bed processes are the two most widely used technologies.
In high shear granulation, as the name suggests, the blend is granulated in a high shear mixer that typically incorporates a main mixing blade and an integral chopper to promote rapid and efficient agglomeration. In a fluidized bed, a binder solution is sprayed onto fluidized particles suspended in an upward flowing heated air stream. Liquid bridges form between the particles, creating larger sized agglomerates from the fine powder. Fluidized bed spray granulation enjoys widespread industrial application and produces a narrower particle size distribution than does high shear mixing. However, it is generally less productive and more difficult to control. High shear granulation also offers the advantages of a high bulk density product and lower binder solution usage.
For all types of granulation the criticality of particle size makes it an easily identifiable candidate for measurement, during process development and into manufacture. Off-line analysis fulfills this requirement to a certain degree but continuous, automated analysis can provide a better information stream for process control, and simultaneously eliminate the risk of exposure to a hazardous material, where this is a concern.
With continuous particle size measurement in place an operator can instantaneously see how a granulation is proceeding, and observe the impact of any operational changes made. Upsets can be detected instantly and new operating conditions are quickly established. The endpoint of the granulation, where this is based on granule size, can be precisely identified.
Beyond this, for continuous granulation processes, in- or on-line measurement provides a platform for automated control, a route to consistent operation at a 'sweet' or optimal point, with the minimum of manual intervention. In a batch process it enables close monitoring of the process trajectory and the confident identification of the process end point. At pilot scale the resulting tight process control improves data quality and experimental productivity. At the commercial scale it translates into higher product quality and/or lower variable cost.
To deliver on this promise the particle sizing system selected needs to measure in a timeframe appropriate to the process dynamics, processes that change more rapidly calling for more frequent analysis. Equally important is reliable operation under process conditions. Clearly with granulation the processing environment can vary considerably depending on the technology selected. Laser diffraction and SFT are two sizing methods with complementary capabilities that together span the broad range of processing conditions encountered. Both provide a solution for real-time granulation monitoring, the choice of technology depending on the processing approach adopted.
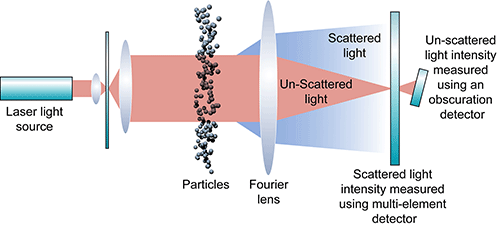
Laser diffraction is a fast, non-destructive ensemble particle sizing method based on the Mie theory, which describes the relationship between light scattering and particle size. Light passing through a sample is scattered by any particles or droplets present. Larger particles scatter the light intensely at a narrow angle; smaller particles scatter more widely at lower intensities. Laser diffraction analyzers detect the scattered light pattern produced by a sample and apply Mie theory to calculate the size distribution of the particle population responsible for it.
Laser diffraction is especially well matched to the demands of dry granulation, and also to certain fluidized bed applications, depending on the size of granules being produced and the moisture levels at the point of measurement. Measuring across the range 0.1 to 2500 microns, the best on- and in-line laser diffraction systems generate as many as four complete particle size distributions per second, providing real-time measurement for even rapidly changing processes. Dilute process streams can be measured in their entirety with no sample preparation, while larger and/or more concentrated streams are measured via a sample loop that takes a representative proportion of the bulk flow.
|
Figure 1 shows a schematic of a typical dry granulation compaction process. The quality of the final granules can be manipulated by changing operating parameters such as: hopper stirrer speed; roller pressure; feed screw speed; roller speed and roller gap, as well as by making changes to the ribbon milling process. Understanding the impact of all of these variables on granule size supports the successful optimization and operation of the process.
|
Trend data recorded during an experiment to investigate the impact of roller pressure is shown in figure 2. Four different roller pressures are assessed as the operating team explore how to shift the product towards the desired particle size distribution. Without real-time measurement such experimentation would rely on off-line analysis and be both slower and less accurate
|
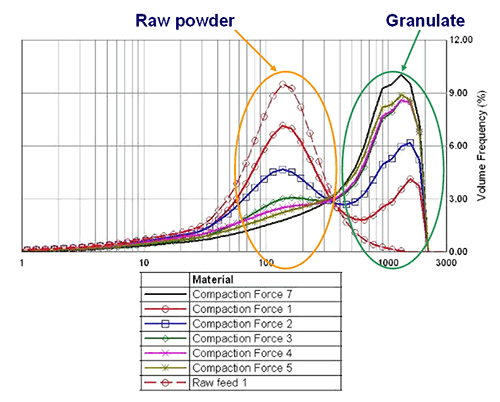
Figure 3 shows data from an extended experiment. Here six different sets of compaction conditions have been evaluated, by changing roller gap and pressure, to target a particular granule size. The data recorded clearly identify the conditions that are most successful, streamlining the development of an optimized operating regime for this particular product.
|
Into commercial manufacture the focus shifts from identifying optimal processing conditions to ensuring consistent operation. In this environment real-time measurement adds value not only by promoting better process control but also by alerting the operator to plant problems.
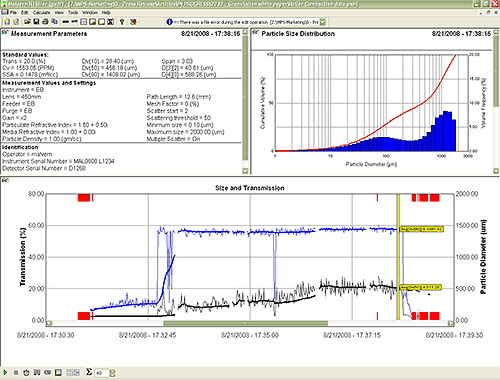
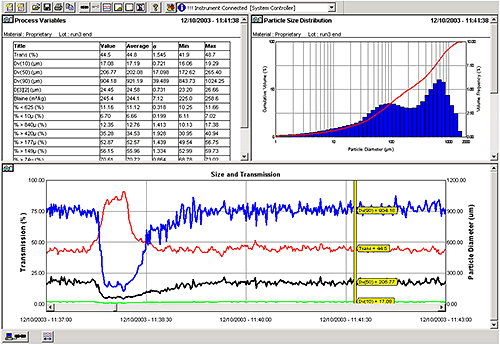
Figure 4 displays trend data recorded during a feed interruption: the red line represents optical transmission, a measure of the amount of material passing through the analyzer and the blue line represents Dv90. During a feed interruption the optical transmission spikes as the amount of material passing through the analyzer falls sharply. Dv90 simultaneously falls. Either event could be used to trigger an alarm and instantly alert the operator to a problem, allowing rapid remedial action that could potentially save an entire batch.
|
SFT as well as delivering real-time particle size measurement offers a number of practical attractions: hardware requirements are low, and relatively simple, easy-to-use, robust systems are commercially available at reasonable cost. The process interface used can be tailored to the application allowing SFT to be used in the monitoring of all types of granulation equipment.
Probes that utilize SFT measure in-line and can be inserted directly into a process vessel, granulator or line. They are able to measure reliably, even in damp, sticky environments with a typical measurement range spanning 50 to 6000 microns. In-line dispersion systems may be used to ensure consistent presentation, and/or dilute the process stream, where necessary, but these are integral to the probe. SFT probes have no moving parts and are available in different lengths which means that the technology, like laser diffraction, transitions easily from development through to commercial production.
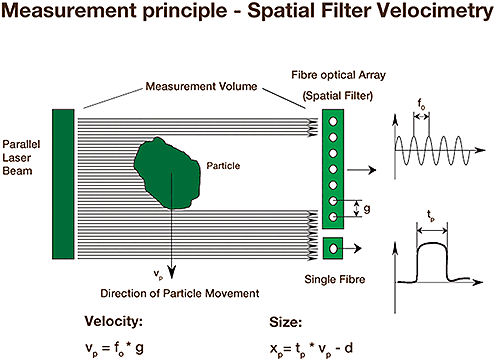
SFT is a number-based, chord length, sizing method that collects data for individual particles to develop a particle size distribution. It involves both spatial filtering velocimetry and spot scanning. Particles falling through a laser beam cast a shadow, interrupting the flow of light to a linear detector array made up of optical fibres. Particle velocity is calculated from the sequential interruption of linearly neighbouring fibre elements of the spatial filter detector, each particle triggering a burst signal, the frequency of which is directly proportional to particle velocity. Particle size is determined using a secondary signal, the pulse signal, which is a measure of the length of time for which the particle blocks a single optical fibre. Measuring a large number of particles generates statistically valid results from which various size parameters and volume-based distributions are derived, depending on the needs of the user.
|
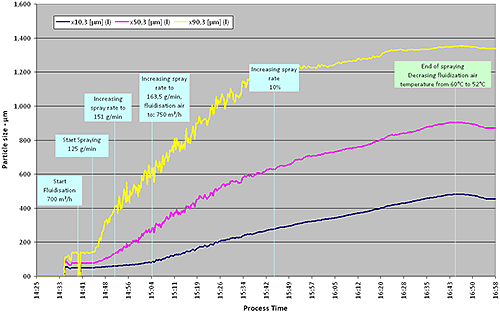
Fluid bed granulation processes may be operated in either batch or continuous mode. Figure 5 shows the results of an experimental study of a batch fluidized bed granulation of 15 Kg of a lactose/cellulose mixture, performed in a pilot scale granulator, a Glatt GPCG 15 with top spray configuration. Particle size data were measured in-line using a Parsum IPP 70 SFT probe. During the process the granulation liquid feed rate, temperature and flow rate of fluidization air were varied to target specific product quality goals, relating to drying behavior, solubility and agglomerate formation, through the attainment of a specific particle size distribution. The particle size data generated during the study were subsequently used to construct predictive models for the final particle size distribution that could be used to closely control product properties.
|
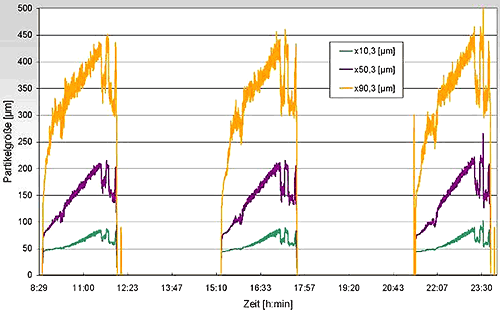
Figure 6 shows the monitoring of a second batch fluid bed granulation: the granulation of 300 kg lactose with an API at a pharmaceutical production site, with automated filling and discharging of the granulator. Here the data show the characteristic chord length values (x10; x50
and x90) of three successive batches. Observing these values in real-time enables the operator to estimate the batch to batch consistency of the production process and improve process control to ensure product quality targets are met and maintained.
|
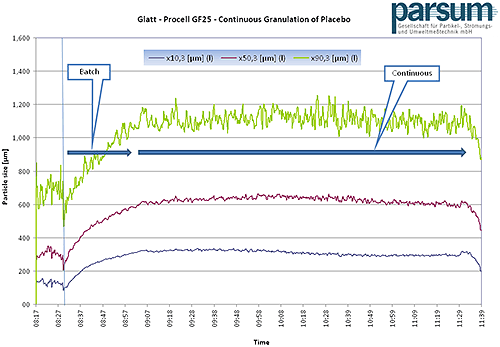
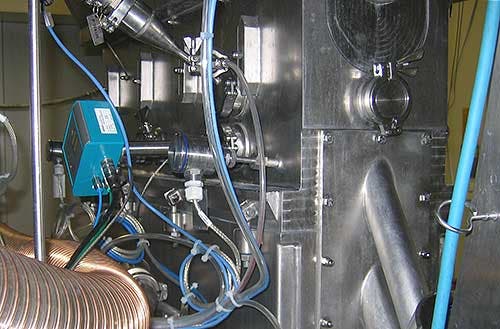
The data in figure 7 demonstrate measurement in a apparatus for the continuous granulation of pharmaceutical products, a Glatt Procell GF25. Here, real-time x10, x50, x90 measurements enable the manipulation of parameters of the granulation process such as: input; output; rate of spraying; and air flow rate; to produce the required particle size in the initial batch period and subsequently to stabilize the process during continuous operation, preventing the formation of agglomerates. In this set-up the SFT probe was installed directly in the last chamber of the fluid bed to ensure a fast response to parameter changes.
|
|
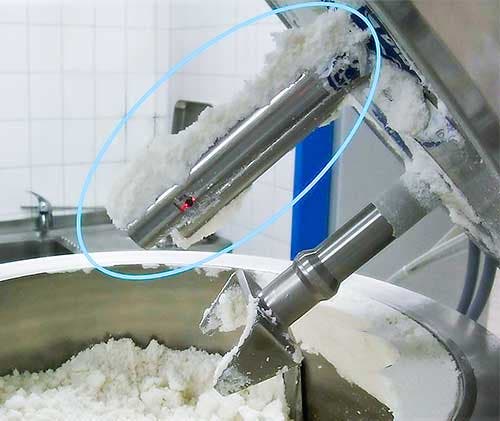
When wet granulating in batch mode with a high shear granulator, as with a fluidized bed, the key issue is to accurately identify the optimal point at which to stop. Where endpoint can be defined in terms of granule size continuous particle size measurement via the installation of a SFT probe enables real-time monitoring of the granulator towards the specified endpoint.
|
|
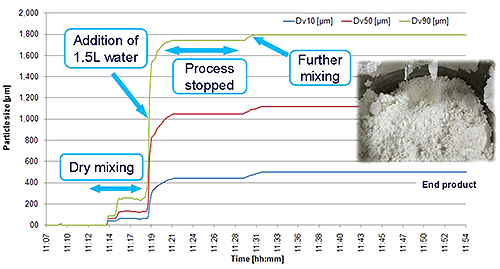
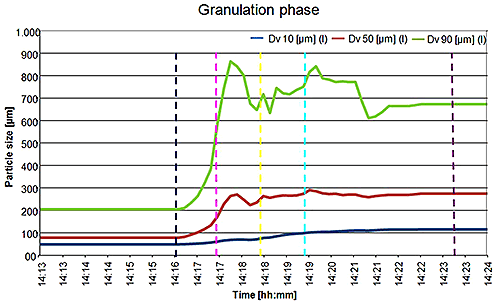
Although this environment is clearly a demanding one for continuous analysis (see figure 10) the results demonstrate the ability of the probe to reliably and precisely measure chord length distribution (x10, x50 and x90) throughout the process. Progression of the granulation process is visible from the particle size trend the addition of water promoting the formation of consistently sized granules with a x50 several times larger than that of the feed.
|
Figure 11 shows the particle size distribution measured on a larger scale with a longer probe, during the course of a wet high shear granulation. This trend captures the evolution of granulate size, over a relatively short timeframe. Immediately prior to the endpoint, however, it presents evidence of a reduction in x90, suggesting a decrease in the larger particle size population. Further scrutiny of the particle size distribution data (graphs not shown) suggests that this observation is attributable to the break up of loosely bound aggregates, rather than true granules, which are undesirable in the final product. The ability of the instrument to precisely detect granulation endpoint is evident.
The widespread application of granulation, both dry and wet, creates demand for analytical solutions that support effective process development, efficient process control, and precise endpoint detection. Since particle size is a defining characteristic for many granules, real-time particle size measurement offers substantial benefit.
Laser diffraction and SFT both offer continuous particle sizing for granulation applications. Laser diffraction is well-matched to dry granulation processes while SFT is particularly suitable for high shear wet granulation monitoring. Both can be applied to monitor fluidized bed processes with in-vessel installation a particular advantage of SFT probes. By providing real-time monitoring these techniques are able to streamline the development of an optimal granulation process and, into production, support the secure process control that delivers the highest levels of manufacturing efficiency. Economic benefits accrue from reduced waste, greater throughput and superior product quality.