Dynamic light scattering (DLS) is a non-invasive technique used for characterizing macromolecules in solution and particles in suspension. The technique measures the time-dependent fluctuations in the intensity of scattered light that occur because the particles are undergoing Brownian motion. The velocity of this Brownian motion is measured and is called the translational diffusion coefficient D. This diffusion coefficient can be converted into a hydrodynamic diameter (DH) using the Stokes-Einstein equation.
DLS has limited capability for resolving different sized particles in a mixture as it is, inherently, a low-resolution technique. The ability to differentiate different size modes in a sample will depend upon a number of factors which include the relative sizes of the different populations present in the sample, the relative intensity of scattering from the different populations present in the sample, the polydispersities of the separate size distributions, the quality of the sample preparation and the quality of the data.
For particles whose size is much smaller than the wavelength of the laser being used (typically diameters which are 1/10th the laser wavelength), the intensity of light scattered will be isotropic i.e. the same at all angles. As the particle size increases, the scattering changes from being isotropic to a distortion in the forward scattering direction. When the size of the particles becomes roughly equivalent to the wavelength of the illuminating light, the scattering becomes a complex function with maxima and minima with respect to angle.
The correlation function obtained from the measurement can be fitted with multiple exponential analyses which have the ability to distinguish between different size populations in a sample. The most common ones available include Non-Negative Least Squares CONTIN and REPES. The resolving ability of these various algorithms can be tested by performing a series of measurements using mixtures of monosized latex standards prepared at different, relative concentrations.
Measurements were made on mixtures of latex standards at dilute concentrations at both 90° and 173° in a Zetasizer Nano S90 and Nano S respectively.
All latex standards used for the measurements discussed in this application note were obtained from Duke Scientific, Palo Alto, California and were traceable to NIST, Gaithersburg, Maryland. Nanosphere™ size standards from the 3000 series were used. Specifically, these were the 60nm (catalogue number 3060A) and 220nm (3220A) standards respectively. All of these standards are supplied at 1% w/v concentration.
For measurements at dilute concentrations, the standards were diluted in 10mM NaCl according to the International Standard ISO13321 and mixed in the appropriate ratios. Measurements were made on either a Zetasizer Nano S90 (detection angle of 90°) or Nano S (detection angle 173°) at a temperature of 25°C. The analysis model used in the Zetasizer Nano software was Multiple Narrow Modes.
The measurements contained in this section illustrate the effect of the detection angle on results obtained. These measurements were performed on diluted standards because of the need to avoid multiple scattering effects in the Nano S90.
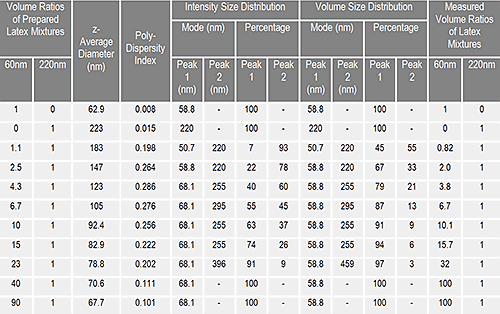
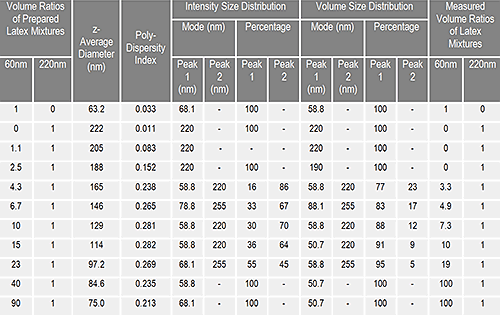
The Duke Scientific 60nm latex standard was prepared by taking 100µl of sample and making it up to 40ml with 10mM NaCl to give in a stock concentration of 0.0025% w/v. The stock 220nm latex had a concentration of 0.00025% w/v (10µml of sample made up to 40ml with 10mM NaCl). These two stock suspensions were mixed in various ratios as shown in table 1 and measured on a Zetasizer Nano S (173°) and a Zetasizer Nano S90 (90°). The results obtained for the measurements are summarized in tables 1 (Zetasizer Nano S) and 2 (Zetasizer Nano S90) respectively.
|
|
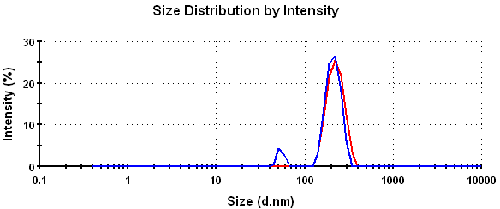
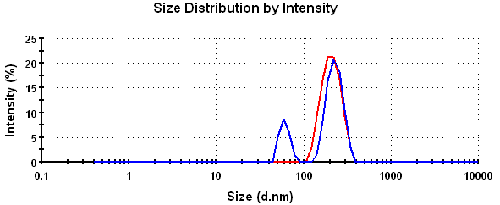
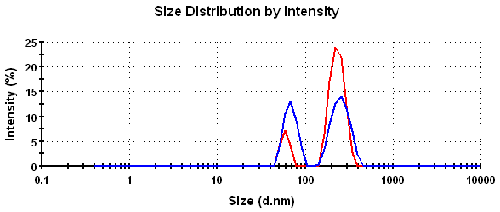
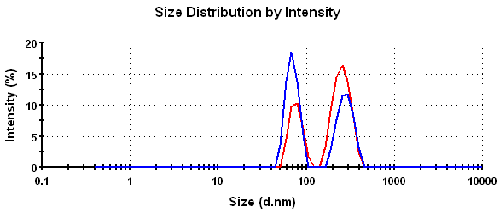
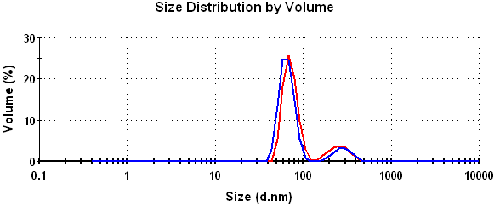
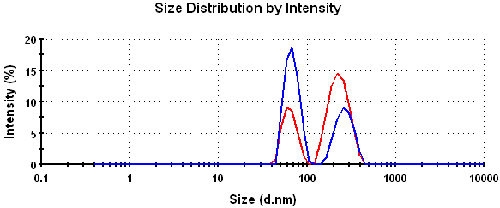
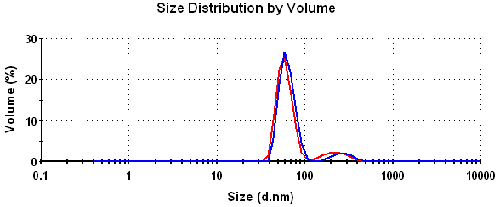
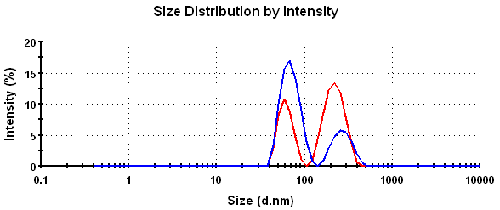
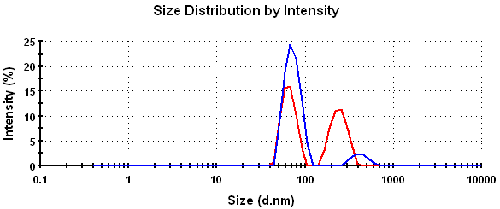
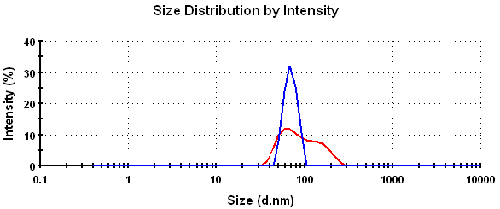
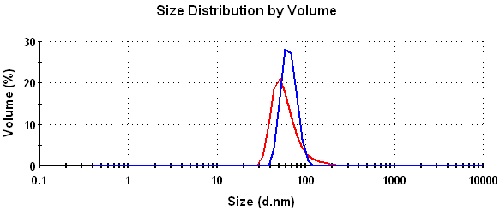
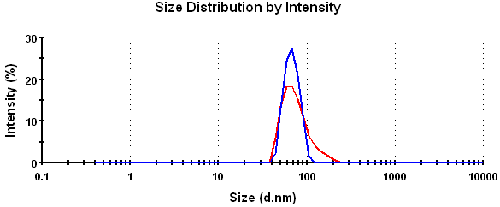
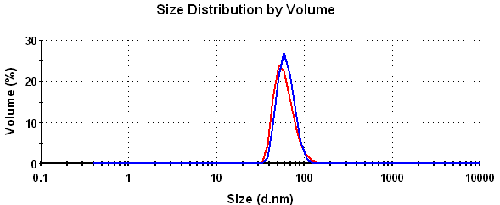
The intensity and volume size distributions obtained for the various volume ratio mixtures at the two detection angles 90° (red plots) and 173° (blue plots) are overplotted in figures 1 to 9 for comparison purposes. It can be seen that the intensity size distributions obtained for a particular volume ratio mixture are quite different at each angle. This is to be expected, as the larger 220nm particles will scatter more light at the more forward 90° angle then the backward 173° angle.
|
|
|
|
|
|
|
|
|
|
|
|
|
|
|
|
|
|
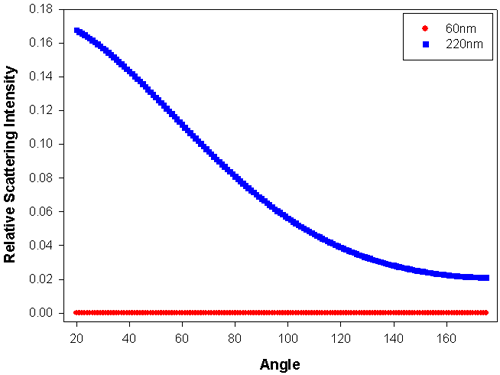
Using Mie theory, the relative intensity of light scattered as a function of angle for any particle size can be theoretically calculated. Mie theory requires the optical properties of both the particle and the medium for this calculation to be made. Using this approach, the relative scattering intensity for polystyrene latex particles of various sizes can be determined as a function of angle. The real and imaginary refractive indices of a polystyrene latex particle are 1.59 and 0.01 respectively. Figure 10 shows such a plot for 60nm and 220nm polystyrene latex particles which are used in this study. The graph shows that the 220nm particles scatter significantly more light at a 90° angle compared to 173°. Therefore, a mixture of 60 and 220nm polystyrene latex particles would be expected to give intensity averaged particle diameters that are higher, the more forward detection angle is used to make the measurement.
|
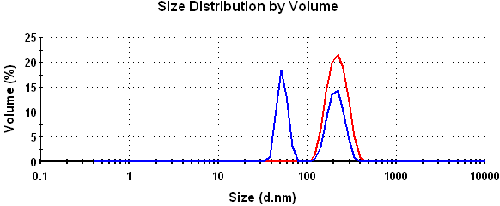
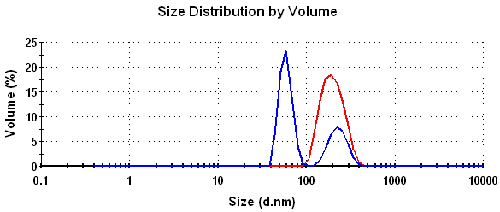
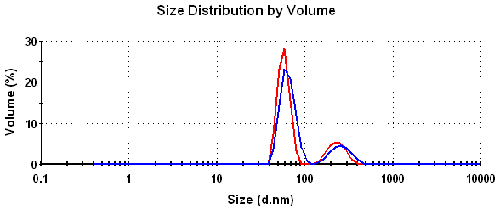
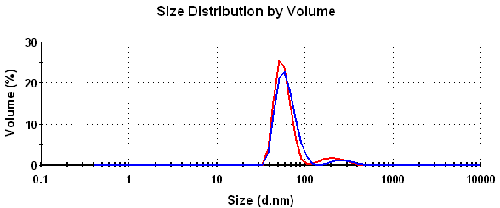
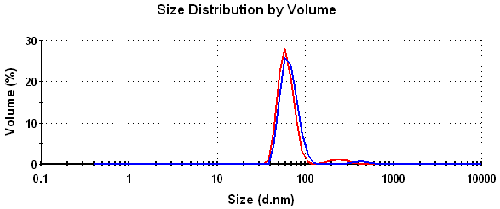
Even though the intensity size distributions obtained for a particular latex mixture are different at the two angles used in this study, conversion of these into volume size distributions using Mie theory results in size distributions that are more repeatable. Again, this is expected as Mie theory takes into account the detection angle used in the measurements.
The scattering from the 220nm latex particles is so dominant at 90° that only monomodal intensity size distributions are obtained for the 1.1:1 and the 2.5:1 volume ratio mixtures at that angle. It is only when the volume mixture of 60:220nm latex reaches 4.3:1 that a bimodal intensity size distribution is obtained at 90°.
When the volume ratio of 60:220nm latex becomes much higher, the resolution of the 220nm peak is more difficult at 173°. For example, figure 7 shows that even though the resolution of the 2 peaks is still achievable at 173°, the peak position obtained for 220nm latex is poor. The result obtained at 90° is excellent. At higher volume mixture ratios (40:1 and 90:1), the resolution of the two populations is not possible at 173°, with the results obtained at 90° showing intensity size distributions consisting of single peaks with shoulders present at high sizes.
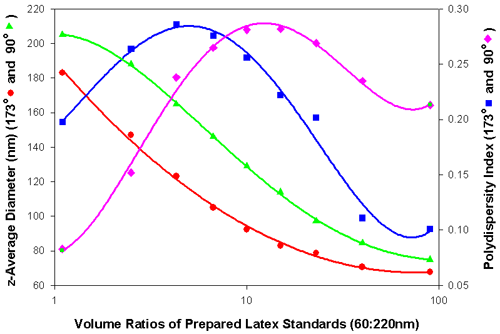
The results from these measurements are graphically represented in figure 11. Here the z-average diameters and polydispersity index values obtained for each volume ratio in the Zetasizer Nano S (173°) and Zetasizer Nano S90 (90°) are plotted.
|
For each volume ratio mixture, the z-average diameter obtained is larger at 90° compared to 173° for the reasons discussed above.
Even though dynamic light scattering is a low-resolution technique, the results presented in this application note have shown that changes in the relative concentrations of each size population can be monitored.
The measurements made on the dilute latex standards at the two different detection angles illustrate that different size distributions by intensity should be expected for particles that show angular dependence in their scattering. However, conversion of the intensity data into volume using Mie theory will give distributions that are independent of angle within a range of relative concentrations.
[1] Dynamic Light Scattering: An Introduction in 30 Minutes, Technical Note available from www.malvern.co.uk
[2] International Standard ISO13321 Methods for Determination of Particle Size Distribution Part 8: Photon Correlation Spectroscopy, International Organization for Standardization (ISO) 1996.
[3] B.E. Dahneke (ed), Measurement of Suspended Particles by Quasi-elastic Light Scattering, Wiley, 1983.
[4] R. Pecora, Dynamic Light Scattering: Applications of Photon Correlation Spectroscopy, Plenum Press, 1985.
[5] M. Kaszuba, M.T. Connah, F.K. McNeil-Watson and U. Nobbmann (2007) Particle and Particle Systems Characterization 24, 159 - 162.
The Zetasizer Nano system from Malvern Instruments is the first commercial instrument to include the hardware and software for combined static, dynamic, and electrophoretic light scattering measurements. The wide range of sample properties available for measurement with the Nano system include, particle size, molecular weight, and zeta potential.
The Zetasizer Nano system was specifically designed to meet the low concentration and sample volume requirements typically associated with pharmaceutical and biomolecular applications, along with the high concentration requirements for colloidal applications. Satisfying this unique mix of requirements was accomplished using a backscatter optical system and a novel cell chamber design. As a consequence of these features, the Zetasizer Nano specifications for sample size and concentration exceed those for any other commercially available dynamic light scattering instrument, with a size range of 0.6nm to 6µm, and a concentration range of 0.1ppm to 40% w/v.
These high sensitivity capabilities can also be applied to real time flow measurements, facilitating Absolute SEC and other HPLC measurements.