
The essential property of a refractory material is its ability to retain its strength at extremely high temperatures. Such materials may also be required to be chemically inert, resistant to thermal shock and to have specific values of thermal expansion or conductivity depending on their use.
The applications of refractory materials can be as diverse as the bricks for lining the inside of a furnace to the heat resistant tiles used to protect the space shuttle during re-entry.
In order to fulfill the requirements of these wide ranging applications there are more than 5000 brand named refractory products [1]. These products are made up of both natural
|
and synthetic materials and are generally combinations of compounds and minerals such as alumina, bauxite, chromite, dolomite, magnesite, silicon carbide and zirconia, as well as many others.
Although the details will vary depending on the application the basic process of producing a refractory material will follow the same general method. The refractory material must be formed into the required shape, either by filling a mold or by coating the required shape to form a mold of refractory material. The material is then heated to high temperatures during which the particles sinter together and the strength of the material is formed.
Both of the above processes are affected by the particle size distribution of the refractory suspension. In the first step the particle size distribution will affect the viscosity of the suspension and therefore how easy it is to handle during processing. Secondly, the sintering phase requires a high packing fraction to ensure good contact between particles, and therefore ensure high temperature strength. The maximum packing fraction is dependent on the particle size distribution of the material.
The challenge in producing a refractory material is therefore to have a high enough solid content to achieve sufficient strength after sintering but without increasing the viscosity such that the material is difficult to handle during the processing stages. For example, it must be possible to pump or pour the suspension into molds, or to dip shapes to be coated into the suspension.
In this application note we will look at how to control the flow properties, or rheology of a refractory suspension, whilst retaining a high solid content by controlling the particle size distribution.
Refractory materials may need to be handled in a variety of different ways in order to form a wide range of products. It is therefore, important to understand how the material will behave under different conditions and how this can be affected by the particle size distribution.
In particular this note will discuss how the viscosity of a suspension is affected by the size distribution of the particles in suspension.
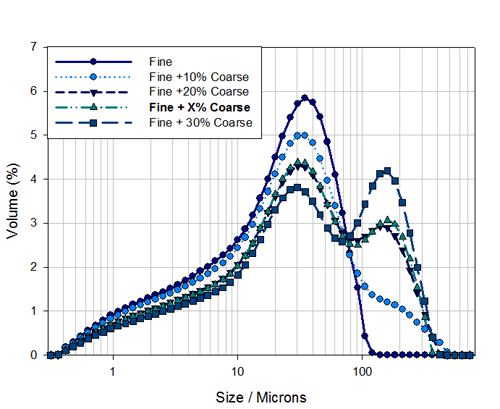
The viscosity of a material describes its resistance to flow and is related to the packing fraction by the following equation;
|
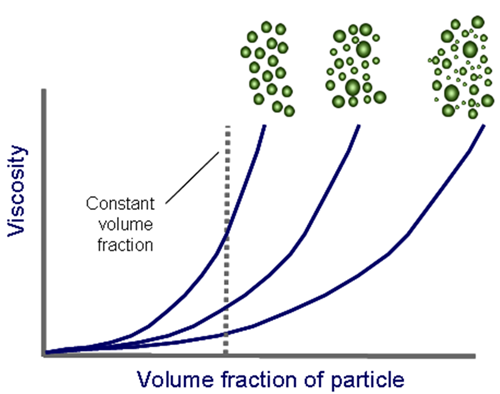
The first thing to look at is the effect of the volume fraction, φ, on the viscosity of the suspension. As more material is added to the suspension, there is less free room for particles to move about in and the viscosity increases. In the case of refractory materials a high solid content is required for effective sintering but this may have an adverse effect on the flow of the suspension, by increasing the viscosity.
However, the viscosity is not dependent on the volume of material alone but the maximum volume fraction as well. In terms of its effect on the viscosity the maximum volume fraction is essentially the amount of space in the suspension that the particles can occupy. Therefore the more available space there is, the more freely the particles can move around and the lower the viscosity.
The maximum volume fraction is dependent on the particle size distribution; the wider the distribution, or the higher the polydispersity, the higher the maximum volume fraction.
|
For example in polydisperse systems small particles can fit in around the larger particles allowing for more freedom to move. Therefore, by increasing the polydispersity of the particle size distribution a higher solid content can be added to the suspension without adversely increasing the viscosity of the suspension.
In this experiment the customer supplied samples of coarse and fine refractory materials as well as several mixtures of the two. The requirement was for the Mastersizer laser diffraction system to accurately determine the volume of coarse material that had been added to the mixed samples. The mixed samples contain different volumes of coarse particles in order to vary the polydispersity of the distribution and therefore adjust the flow properties of the suspension for different applications.
In three of the samples the volume of coarse material was known. The fourth sample, sample X, contained an unknown volume of seeded coarse material. The measurements described here were used to confirm the volume percentage of coarse material in the known samples and to determine how much coarse material had been added to sample X.
Particle size information was obtained by laser diffraction using the Mastersizer. The samples were dispersed in water using the large volume dispersion unit. Laser diffraction instruments operate by using laser light to illuminate a sample of particles suspended in a medium. The instrument then records the light scattered by these particles using a number of detectors covering a wide range of angles. This scattering data can then be related to the size of the particles on the basic principle that
|
large particles scatter light at low angles and small particles scatter light at high angles. The particle size distribution can then be calculated from this scattering data using an appropriate optical model.
The Mastersizer is ideally suited to this type of application due to the wide size range over which measurements can be made without the need for optics changes. This means that the Mastersizer can be easily used to measure even extremely polydisperse distributions without blending results. This will enable the volume of coarse material in a polydisperse system to be easily and accurately determined.
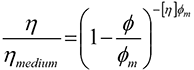
The particle size distributions for the separate fine and coarse samples are shown in Figure 2 . This shows that the fine sample covers 0.3μm to 100μm and the coarse sample contains material in the range 60μm to 300μm.
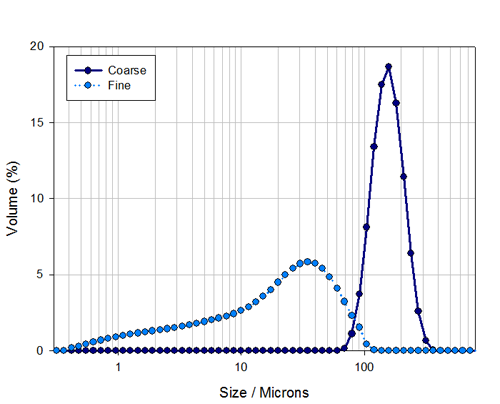
The particle size distributions for the fine material and the four mixed samples are shown in Figure 3 . This shows the known mixtures, containing 10%, 20% and 30% coarse material, as well as sample X containing an unknown coarse particle fraction.
Using the particle size distribution data for the samples with known volumes of coarse material, the volume of coarse material added to sample X can be determined. This note will cover how two different parameters calculated by the Mastersizer can be used to determine the volume of coarse material in sample X.
Firstly as laser diffraction reports a volume based distribution we can easily report the volume of material above a particular size. From Figure 3 , it can be seen that the minimum between the two populations is at about 80μm then the percentage volume of material above 80μm should correlate well to percentage of coarse material.
The D[4,3] is the volume weighted mean and as such is the sensitive to the amount of coarse material in a sample. Therefore the D[4,3] should also correlate well to the percentage of additional coarse material added to the sample.
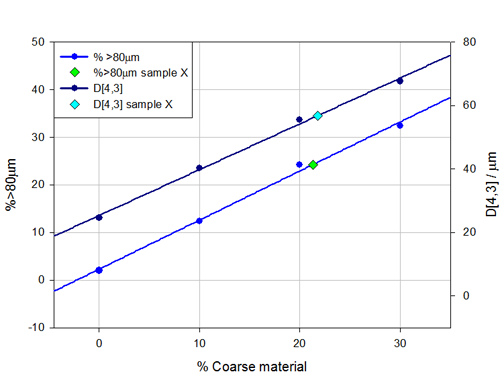
In Figure 4 the values of the D[4,3] and the percentage volume greater than 80μm have each been plotted against the known volume of seeded coarse material. The graph shows that both of these relationships are linear and can therefore be used to determine the volume of coarse material that had been added to sample X.
From the measurements of the D[4,3] the volume of coarse material added to sample X was determined to be 21.8% and this value is plotted in light blue on Figure 4 . The percentage over 80 micron gives a value of 21.3% for the volume of coarse material added to sample X this is plotted in green on Figure 4 . Averaging these two results gives the volume of coarse material added to sample X as 21.6%. Once the measurements had been made the customer confirmed that sample X contained 22% of coarse material. This result is within expected performance of laser diffraction measurements according to the ISO standard [2].
The Mastersizer has been successfully used to characterize several samples of refractory suspensions. The samples are a mixture of both fine and coarse particles. Such mixtures are created in order to control the viscosity and packing density of the suspension. Altering the proportions of fine and coarse particles affects the polydispersity of size distribution and this can be used to achieve a high packing fraction as well as a suitable viscosity.
The Mastersizer was used to measure both the fine and coarse material separately. The customer also provided 3 samples to which known values of coarse material had been added (10%, 20% and 30%). An additional sample, sample X, was also provided for which the amount of seeded coarse material was to be determined.
Using the measurements of the three known samples and the original fine material a linear relationship has been demonstrated between both the D[4,3] and the percentage coarse material as well as between the volume over 80μm and the percentage coarse material added. From this linear relationship the amount of coarse material in sample X was determined to be 21.6%. The customer then confirmed that 22% coarse material had been added to the unknown sample. This has demonstrated how laser diffraction measurements can be used to determine the volume of seeded material in a polydisperse distribution.
[1] The Refractories Institute, http://www.refractoriesinstitute.org/aboutrefractories.htm
[2] ISO 13320:2009 Particle Size Analysis - Laser Diffraction Methods
|