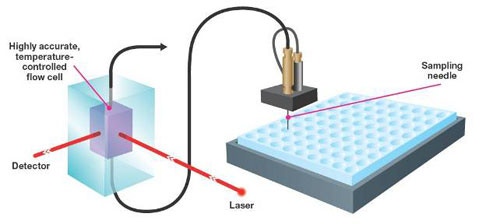
The Zetasizer APS is an automated dynamic light scattering (DLS) instrument which uses any industry standard 96 or 384 well plate. To ensure that the measurements are of the highest sensitivity and reproducibility, the sample is transferred from the plate well to a high optical quality quartz cell.
In the Zetasizer APS, the sample is aspirated to the measurement cell via a syringe needle and tubing using a syringe pump (figure 1).
|
The sampling strategy must ensure that no cross-contamination of samples occurs. The approach chosen in the Zetasizer APS is to use two rinse solutions to clean the system: the solvent and a wash solution. These rinse solutions allow the cleaning of the sampling system as well as the measurement cell between each sample.
In this application note two typical experiments; protein size and thermal trend measurements, are used to demonstrate how the strategy of dual rinse solutions works to avoid cross-contamination of samples.
The first example is the size measurements of two standard proteins, bovine serum albumin (BSA) and lysozyme.
A 96-well plate was set up with 200µl of 10mg/ml BSA and lysozyme samples in well A1 and A2, respectively. The Zetasizer APS was set up to sample alternately between these two wells for a total of six sampling rounds. For each protein sampled, three repeat measurements were performed. After measurement, the sample was returned to the well and the system was cleaned by rinsing with 5ml of de-ionized water before sampling the next well.
As the samples are returned to their wells after measurement, the action of alternating between two wells should increase the possibility of detecting cross-contamination as the amount of contamination should increase as the number of alternating measurements increase.
Lysozyme is the smaller protein, with a molecular weight of 14.7kDa, and BSA the larger protein with a molecular weight of 66.4kDa. Estimated molecular sizes can be determined from known molecular weights using established empirical relationships [1]. The molecular weights of lysozyme and BSA monomer correspond to globular proteins with radii of 1.9nm and 3.6nm respectively.
As the amount of scattered light scales with the radius^6, a BSA molecule would be expected to scatter more than 46 times more light than each lysozyme molecule. Therefore the effect of any cross-contamination present would be detectable in the measurement of the lysozyme samples.
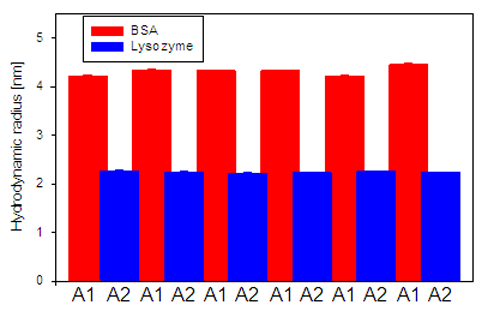
The results from the size measurements of BSA and lysozyme are displayed in figure 2. The sizes measured for the two proteins are both repeatable and reproducible. BSA samples typically show greater variation in size as it normally exists in equilibrium between monomer, dimer and trimer conformations.
|
If there had have been cross-contamination between the two samples the sizes determined would have started to approach each other, as the Lysozyme sample would contain increasing amounts of BSA and vice versa.
Instead, a stable size is determined for both protein samples, indicating that there is no cross-contamination present.
The second example shows a set of thermal trend measurements performed on a number of proteins under various buffer conditions. This type of measurement is used to induce thermal stress on the sample to monitor the sample's stability dependence on buffer composition.
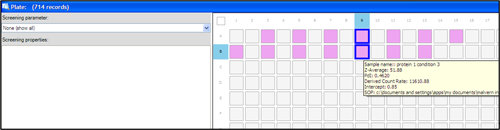
The samples used in this study were prepared at the same time, filtered through a 20nm pore size filter (Whatman Anotop10) and loaded into every second well of a 384 well plate as shown in the plate navigator (Figure 3). The samples were measured in rows, starting with well A3, A5 etc until well B13. The protein size was measured between 20°C to 70°C, in 1°C steps.
|
In between each thermal trend measurement, the system was cleaned by flushing with 2.5ml de-ionized water, followed by 2.5ml of 20% ethanol in de-ionized water and finally 5ml of de-ionized water to ensure that no ethanol remained in the cell, the needle or in the tubing.
Ethanol was selected as the wash fluid after the thermal scans as proteins often expose hydrophobic parts upon denaturation which can interact with the tubing for example. The presence of ethanol diminishes the possibility of interaction and enables the instrument to clean out any denatured protein.
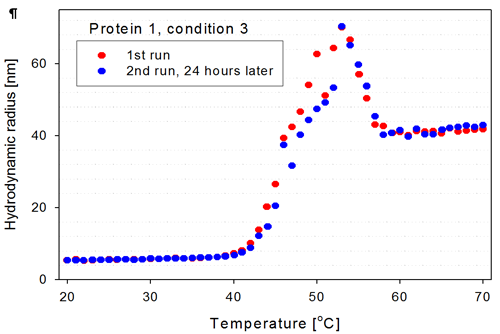
For the two wells selected in figure 3 (wells marked with thick blue lines), the corresponding thermal trends are shown in figure 4. These are trends of a protein in a certain buffer condition but with more than 24 hours in between measurements. The Zetasizer APS measured seven thermal trends of other proteins (wells A11 to B7) between the measurements of the samples in well A9 and B9.
|
The two trend curves from wells A9 and B9 overlap well in the low temperature range (20°C-40°C), as expected if the sample is stable over the time period of days. There are no aggregates present in the second measurement at the lower temperatures as one would expect if the needle, flow cell and tubing are properly cleaned between measurements.
As the protein starts to unfold, the size increases and the samples show the same trend, although there are slight differences in the size determined for the aggregates in the temperature range from 40°C to 55°C. Above 55°C, the aggregates again show good overlap, indicating that the final aggregate form is stable for this protein construct.
The Zetasizer APS is supplied with recommended cleaning protocols, a standard wash and a vigorous wash. The standard wash consists of 3ml of solvent flushed through the system. The vigorous wash starts with a standard wash (3ml of solvent) followed by 3ml of a wash fluid and finally 4ml of the solvent to rinse out the wash fluid. The solvent and wash fluid can be de-ionized water and 20% ethanol in de-ionized water in the simplest case.
If the user knows that the samples they are working with are "sticky", the Zetasizer software contains the feature of user-defined cleaning protocols, allowing the user to define other wash liquids as well as increased volumes.
The size measurements and the thermal trend measurements of proteins summarized in this application note, have demonstrated that the cleaning protocols used in the Zetasizer APS, ensure that no cross contamination occurs.
[1] P. Claes, M. Dunsford, A. Kenney and P. Vardy in Laser Light Scattering in Biochemistry (1992) S.E. Harding, D.B. Sattelle and V.A. Bloomfield (eds) Royal Society of Chemistry.