A description of how advanced GPC/SEC detection can overcome inaccuracy in the measurement of molecular weight caused by deviation in the structure of the sample protein from that of the protein standards or interaction with the chromatography column matrix.
Work performed in conjunction with the Institut Pasteur, Paris, France
Size exclusion chromatography (SEC) is a well-established technique for measuring the molecular weight (MW or molar mass) of proteins. Traditionally this method involves comparing the column retention volume of a sample to that of a series of known MW standards. Importantly the separation process in SEC is controlled by the hydrodynamic volume of a molecule, not the molecular weight, therefore the results produced by this method are only relative to the standards used to calibrate the system. How close the "relative" MW is to the real MW of a sample is controlled by how similar the standards and analyte structures are. This means any deviation in the structure of the sample protein from that of the protein standards will negatively influence the accuracy of the result. In addition to this, some proteins can interact with the column matrix or change their hydrodynamic volume during elution. In those situations, it is impossible to rely on the retention volume to calculate the MW of the measured molecule.
The addition of advanced detectors to chromatography systems allows the absolute MW of a sample to be measured independent of any standards or sample elution volume.
In this application note we will look at two examples where the retention volume of a sample could not be used to obtain an accurate measure of the sample MW. We will also describe the additional information that can be obtained using these advanced detectors.
In both of the applications reported in this note, the instrument used was a Malvern Panalytical multi-detection SEC system.
OMNISEC software was used to control the entire system and to acquire the signals from the five detectors of the multi-detection system: a UV-Visible spectrophotometer, 7° Low Angle Light Scattering (LALS) and 90° Right Angle Light Scattering (RALS) detectors measuring the static light scattering intensity, a differential refractometer (RI) and a differential pressure (DP) Wheatstone bridge viscometer. OMNISEC was used to calculate the absolute molecular weight (MW) as well as the intrinsic viscosity (IV) of the protein from the above-mentioned measurements (RI, UV, LALS, RALS and DP).
Ideally when analyzing samples by SEC there should be no interaction between the sample and the chromatography column matrix. However, in real world experiments this is not always possible. The advantage of using an advanced detector system is that even if there is interaction between the sample and the packing material the absolute MW values can still be obtained.
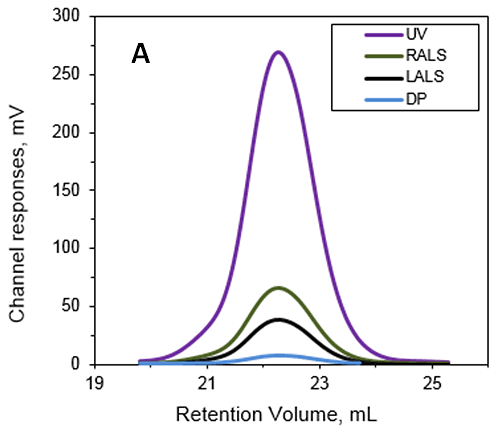
This work studied Anthrolysin (ALO), which is a pore forming cholesterol-dependent cytolysin (CDC) secreted by Bacillus antracis. Research suggests that ALO plays a role in the pathogenesis of Anthrax. An SEC experiment was performed using a Superdex 200 (GE Healthcare) with a buffer containing 20mM Tris, 150mM NaCl, pH 7.3. The multi-detection system used to determine the MW and IV of ALO in solution with the results shown in Figure 1.
|
|
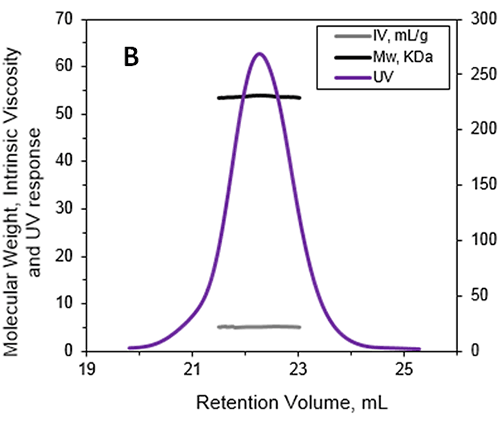
The absolute MW was calculated to be 53.6 kDa indicating that ALO exists as a monomer when in solution. A retention volume of 22.2 mL was recorded for the peak probably due to interaction between the sample and the packing material. If a traditional column calibration method had been used this would have corresponded to a MW of only 15-20 kDa. This demonstrates the necessity of using light scattering detectors to prevent the underestimation of sample MW. Importantly, it is not always possible to determine when there has been interaction between the sample and the packing material. This means that without the advanced detectors used in this work, the underestimation of protein MW frequently goes unnoticed.
In addition to measuring the absolute MW of ALO the addition of an online differential viscometer allowed the IV to be measured. The IV is a measure of the contribution of a single molecule of a solute to the overall viscosity of the solution. The IV is inversely proportional to the molecular density of a material so any changes in protein structure, shape and hydration (i.e., flexibility) will lead to changes in the volume of that protein and consequently the density. For ALO (53.6 kDa) the IV was measured as 5.1 mL/g. As a comparison the monomer of a BSA (66.5 kDa) has an IV of approximately 4 mL/g. IV and hydrodynamic radius data combined together allow the estimation of the shape and hydration of ALO (see references 1 and 3): ALO hydration is low, indicating that the protein is folded; ALO shape is elongated, in agreement with the conical shape of the X-ray structure.
One of the biggest limitations of traditional SEC experiments is the inability to account for structural differences between the standard and the analyte of interest. This example focuses on proteins of the Bcl-2 family. These proteins are molecular transducers sensitive to internal and external apoptotic signals and they play a key role in the regulation of apoptosis. Their aggregation can lead to the formation of amyloid fibres due to protein misfolding which are associated with numerous diseases. The formation of amyloid deposits has been shown to correlate with abnormal apoptosis in neurodegenerative pathologies. In vivo, the control of apoptosis is dependent on the interaction between members of the Bcl-2 family through the formation of hetro-oligomers.
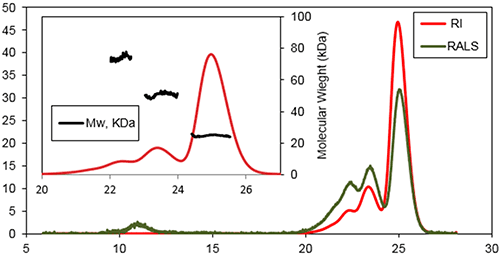
This work focused on the in vitro formation of aggregates by a Bcl-2 protein initiated by incubation of the protein at 37°C. SEC was used to characterize the early events occurring during the aggregation process following incubation for 1 day and 1 week. Figure 2 is a typical triple detection chromatogram following 1 day of incubation at 37°C. SEC was performed using a Superose 6HR (GE Healthcare) with a buffer of 20 mM sodium phosphate , pH 8, and 150 mM sodium chloride.
|
Three main species were detected at the following retention volumes: 22.6, 23.6, and 25.1 mL, with molecular weights of 74±3 kDa, 51±2 kDa, and 25±2 kDa, respectively. The main population of this sample was found to be the later species, the protein's monomeric state. A shoulder was detectable on the peak of the trimer, which likely corresponded to a small population of tetramer. An additional species was detected eluting at 11 mL. This species was recorded by the light scattering detectors but not by the refractive index detector. This is a typical response for protein aggregates which have a very high MW, so scatter a lot of light, but a low concentration.
If a traditional method of column calibration had been used for this work the Bcl-2 monomer (25.1 mL) would have had an apparent MW of only 40 kDa. This data suggested that although Bcl-2 was monomeric, its hydrodynamic radius (RH) was higher than expected. Assuming there was no interaction between the sample and the column matrix, this effect could arise due to a high protein hydration and/or a deviation from the spherical shape. The Bcl-2 is a globular shaped protein with eight α-helices and flexible loop linking the first α-helix to the core of the protein. This flexible loop plays a crucial role in the samples elution profile giving the protein a higher RH than would be expected for a compact protein with this MW.
The samples were also analyzed after incubation for 1 week at 37 °C. Following this extended incubation period more aggregates were found to have formed. The SEC experiments showed that the first step of the fibre growth is the formation of small aggregates, mostly dimers and trimers, which further assemble into larger aggregates.
SEC is an invaluable tool in the research of proteins and their functionality. Here we have discussed the drawbacks of relying on traditional column calibration techniques when measuring the molecular weight of samples. The use of a multi-detection system means that we can calculate the absolute molecular weight of a protein and its oligomers independent of the retention volume or any standards used for apparent molecular mass calibration. This advanced method has also been shown to be able to distinguish between oligomeric state, extent of aggregation, and hydration or shape differences within a sample.
Bourdeau, R. W., Malito, E., Chenal, A., Bishop, B. L., Musch, M. W., Villereal, M. L., Chang, E. B., Mosser, E. M., Rest, R. F., and Tang, W. J. (2009) Cellular functions and X-ray structure of anthrolysin O, a cholesterol-dependent cytolysin secreted by Bacillus anthracis. J Biol Chem 284, 14645-14656.
Chenal, A., Vendrely, C., Vitrac, H., Karst, J. C., Gonneaud, A., Blanchet, C. E., Pichard, S., Garcia, E., Salin, B., Catty, P., Gillet, D., Hussy, N., Marquette, C., Almunia, C., and Forge, V. (2012) Amyloid fibrils formed by the programmed cell death regulator Bcl-xL. J Mol Biol 415, 584-599.
Karst JC, Sotomayor-Pérez AC, Ladant D, Chenal A. (2012) Estimation of intrinsically disordered protein shape and time-averaged apparent hydration in native conditions by a combination of hydrodynamic methods. Methods Mol Biol. 2012;896:163-77.