
Size exclusion chromatography (SEC) and dynamic light scattering (DLS) are technologies common to protein laboratories. SEC is routinely used for purification, identification, and quantification of protein mixtures, while batch DLS is routinely used for pre-column size & polydispersity measurements, along with aggregate quantification. The coupling of DLS & SEC technologies has been difficult, due in large part to the fact that eluted protein sample concentrations tend to be well below the detection limit for most DLS instruments. As shown in this application note the high sensitivity Zetasizer Nano from Malvern Instruments can address this low protein concentration challenge.
Dynamic light scattering measures light intensity fluctuations due to laser light scattering from particles or molecules moving under Brownian motion, to determine the size distribution of an ensemble of particles in solution. Size information is extracted from the measured correlogram by exponential fitting, where only the temperature and the medium viscosity are required.
Size Exclusion Chromatography SEC separates materials based on their hydrodynamic size. The larger molecules elute first with smaller molecules eluting at bigger elution volumes. This may be interpreted as a size distribution.
Combining the high resolution of chromatography with the ease of data acquisition from DLS can quickly confirm peak identity.
A Superdex 200 column (GE Healthcare, Uppsala, Sweden) was used for the analysis of an Antibody (IgG4) of expected molecular weight near 150 kDa. The protein was prepared in 0.1 M ammonium bicarbonate buffer (pH not adjusted) at a concentration of 7 mg/mL. 100 μL were injected, i.e. the column was loaded with 0.7 mg of protein.
The system was run at a flow rate of 0.5 mL/min, and the dynamic light scattering data accumulated continuously and analyzed every 3 seconds. The software recorded all correlation functions and intensity values.
Figure 1 shows the z-average size (DLS) and the light scattering intensity trace. The sample contained a range of larger assemblies that eluted shortly after the void volume. The antibody was separated into two peaks. The main monomer is mono-disperse, indicated by the flat plot of size as a function of volume.
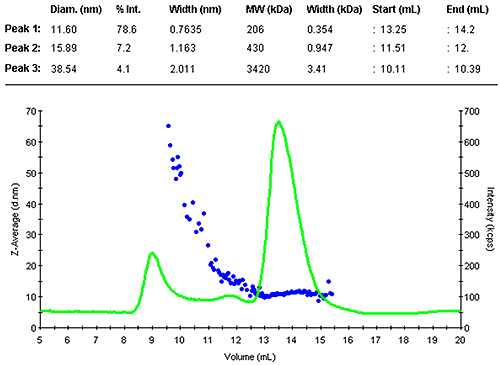
|
The monomer peak eluted between 13.3 and 14.2 mL and had a diameter of 11.6 nm. This is close to the expected size for this molecule. A prediction of the molecular weight from the measured size leads to 200 kDa, as expected slightly larger than the nominal 150 kDa. The increased estimate is due to the Y-shape of the molecule, this protein family is not an ideal fit with the globular protein family model. A typical compact globular protein of 150kDa would have a size of 10 nm. Nevertheless, this estimate clearly confirms the presence of the monomer.
The results may also be interpreted in terms of a volume distribution. Figure 2 shows the eluted size distribution by volume, with its associated summary of the findings. The vast majority (95.8% by mass) is contained in the monomer elution peak.
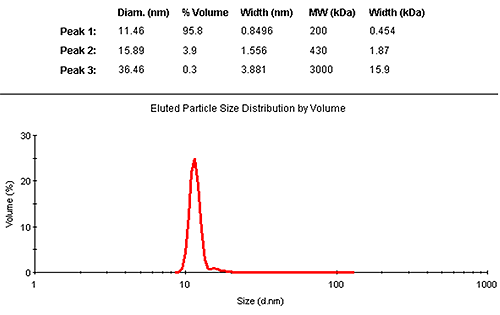
|