
The complementarities of two techniques, dynamic light scattering (DLS) and static light scattering detector coupled with a size exclusion chromatography system (SEC-LS), are illustrated by studying a number of samples where a thermally denatured and aggregated protein sample were dosed at different levels into a non-denatured protein sample.
Bovine serum albumin (BSA), a 66kDa protein that normally exists in equilibrium between monomers, dimers and trimers was used in this study.
The lyophilized protein was dissolved in phosphate buffered saline (PBS) at pH 7.4 and filtered with a 0.02µm Whatman Anotop 10 filter to remove any pre-existing aggregates. The sample was thereafter divided into two lots, of which one was kept at room temperature and the other was kept overnight at 65°C. Heating BSA to 65°C (its melting point) thermally denatures some of the sample and forces the formation of aggregates.
The thermally denatured and non-denatured samples were analyzed on the Viscotek GPC TDAmax to determine the quantity of aggregates present in each sample, in this case BSA oligomers larger than dimers are considered to be aggregates.
In the thermally denatured BSA sample, approximately 45% of the sample was found to be aggregated.
In the sample left overnight at room temperature, the light scattering signal showed trace amounts of higher aggregates present but the amount was too low for the refractive Index (RI) signal to detect, and hence quantitation was not possible.
The thermally denatured BSA sample was dosed at different amounts into the non-aggregated sample and the mixtures were measured firstly by DLS on the Zetasizer Nano-S and then by SEC-LS using a Viscotek TDAmax to allow a direct comparison of the results produced by the two techniques.
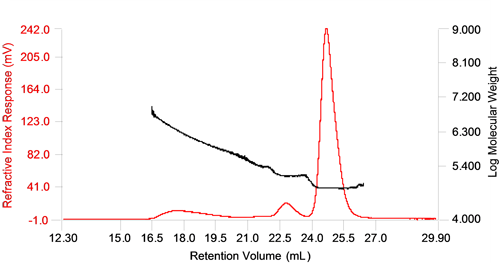
Figure 1 shows a chromatogram of the sample containing 11.5% of thermally denatured and aggregated BSA sample. The traces shown are the refractive index response (RI) and the molecular weight trace. The molecular weight was determined by combining the RI with the static light scattering signal (LS).
|
The monomer and dimer peaks are well resolved and the molecular weight measured across them does not change showing low polydispersity, but the higher oligomer and aggregate peaks are not as well separated and display a high polydispersity, with a large distribution of molecular weight across the peak. A high polydispersity is common for protein aggregates since aggregates typically do not form well defined populations but rather a range of sizes which ultimately depend on the amount of protein available for aggregate formation.
The results from the different samples are displayed in table 1, where the dosed aggregate amount is the % of moles of the aggregated BSA sample compared to the total moles of protein in the sample. Column two shows the weight fraction of aggregates determined with SEC-LS. In the samples with low amounts of aggregates present, the quantization is less precise, although the results are in the expected range. It is the RI signal at these low concentrations which decreases the measurement precision.
SEC-LS | DLS | |||||
|---|---|---|---|---|---|---|
| Dosed aggregate amount (%) | Measured
aggregate | Int% pk1 | Int% pk2 | Vol% pk1 | Vol% pk2 | %Pd |
| 0 (filtered with 20 nm pore
size before measurements) | - | 100 | 0 | 100 | 0 | 21.4 |
| 0 (sample left at 25°C over night) | 0 | 99.1 | 0.9 | 100 | 0 | 33.2 |
| 0.225 | 0.4 | 97.1 | 2.9 | 100 | 0 | 36.1 |
| 0.45 | 0.6 | 94.4 | 5.6 | 100 | 0 | 41.2 |
| 1.125 | 1 | 87.5 | 12.5 | 100 | 0 | 48.0 |
| 2.25 | 2.1 | 75.9 | 24.1 | 99.8 | 0.2 | 53.8 |
| 4.5 | 4.4 | 53.5 | 46.5 | 99.4 | 0.6 | 59.2 |
| 11.25 | 10.6 | 30 | 70 | 96.7 | 3.3 | 57.4 |
| 22.5 | 21.8 | 17.9 | 82.1 | 90.2 | 9.8 | 51.0 |
| 45 | 44.5 | 0 | 100 | 0 | 100 | 42.4 |
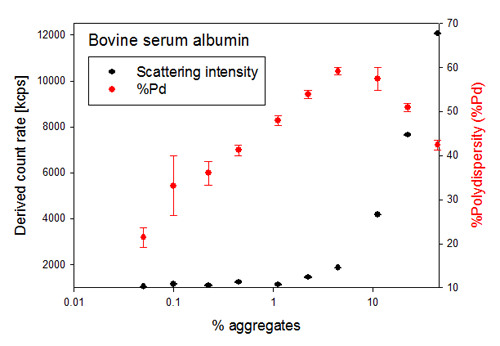
The first sign of aggregation in a sample as detected by DLS, is typically a change in the total intensity of light scattered by the sample, as the amount of light scattered by a sample is proportional to the particle diameter to the sixth power and the amount of molecules present, i.e. the sample concentration. This can be seen in figure 2, which also shows the %Polydispersity (%Pd) for each sample. The %Pd is calculated from the polydispersity index (PdI) [(100*(PdI)½] and its value ranges between 0% and 100%. Typically a very monodisperse sample has a %Pd below 20%.
|
As seen in figure 2, %Pd changes rapidly as small amounts of dosed aggregates are added to a non-aggregated sample. %Pd is a relative value which increases with the amount of aggregates in the sample, but at a certain level of aggregation the %Pd starts to decrease. This behaviour is due to the fact that %Pd reports on the polydispersity of the sample, i.e. how many different size populations are simultaneously detected in the sample, and not on the aggregation state of the sample.
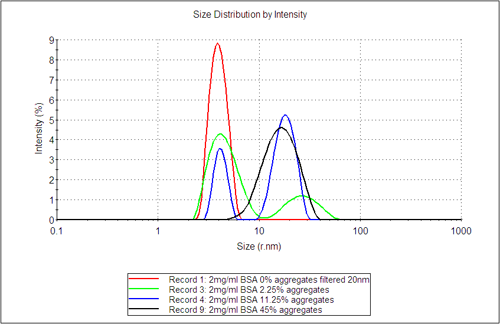
Figure 3 shows the DLS distribution analysis results, which highlight the appearance of a second aggregate population as the amount of dosed aggregate content increases. The distribution analysis by intensity gives the fraction of light scattered from the different populations, whereas the volume fractions, as estimated using Mie theory, gives the relative fraction in terms of volume (mass) for the different populations. These values are shown in table 1. In columns 3 and 4 the sensitivity of DLS to detect trace amount of aggregates in terms of the amount of light they scatter is clearly shown. This is highlighted for example by comparing the sample filtered with a 20nm filter directly before measurement with the sample left overnight at 25°C.
|
The volume fraction in comparison only detects significant aggregate content where the dosed level of aggregates exceeds 2.25%. Comparing the relative volume fraction of the sample estimated from DLS with the weight fraction determined by SEC-LS clearly shows that although DLS is a non-quantitative technique, it does provide a quick and early indication of aggregate formation in a sample.
By comparing the SEC-LS and DLS results of aggregate detection in Table 1, it is clear that each technique provides the user with different but complementary information. SEC-LS can quantify the amount of aggregates present in a sample down to below 1% and can determine the polydispersity of the individual sample peaks, as well as report the molecular weights of the molecules eluting in the different peaks. The accuracy of quantitation of SEC-LS is due to the relative sensitivities of the RI detector and LS detectors which mean that at the lowest concentrations of aggregates, the RI detector cannot quantify the aggregated material that the LS detector can identify as present.
DLS' sensitivity to small amounts of larger material in a sample and its short measurement time means that it is often used in formulation trials, e.g. forced degradation studies where it detects the early onset of aggregation. DLS has the advantage of measuring directly in the formulation buffer without the need for a column specific elution buffer, which minimizes the risk for buffer induced changes in the sample.
SEC-LS and DLS are complementary techniques; DLS can detect the early onset of aggregation in different formulation buffers and hence be used to screen a range of sample formulations, SEC-LS is a quantitative technique with increased sample resolution provided by SEC, which can be used to determine the amount of aggregates and oligomeric populations, as well as identifying their individual molecular weights in formulations of interest.