
The physical properties and behavior of polymers and polysaccharides depends strongly on the properties of the molecules themselves. Molecular weight and molecular weight distribution, molecular size and structure all affect how the material will behave. Gel-permeation chromatography (GPC), also called size-exclusion chromatography (SEC), is the most commonly used tool for assessing these parameters.
The principle of GPC involves separating the sample as it travels through a porous but inert column matrix. While smaller molecules penetrate the pores more deeply, larger molecules are excluded and thus travel through the column faster. The result is a separation based on hydrodynamic volume but the desire is to know the molecular weight of the sample. Previously, molecular weight was estimated by comparing the elution time of the sample to that of standards of known molecular weight. Now, however, a light scattering detector is a common tool that allows polymer molecular weight to be measured independently of retention time. The concurrent measurement of Rg using multi-angle light scattering (MALS) and intrinsic viscosity offers exceptional insight into the structure of synthetic and natural polymer molecules as well as their molecular weight.
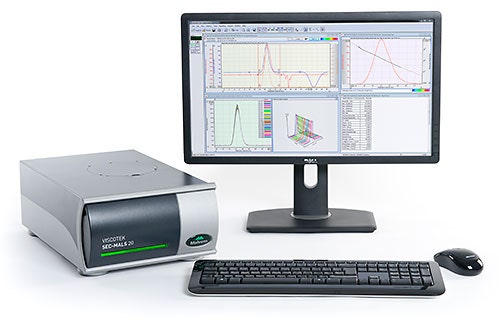
The Viscotek SEC-MALS 20 (figure 1) is a 20 angle light scattering device capable of making measurements of molecular weight and Rg (radius of gyration). It can be used as part of a multi-detector GPC system that combines light scattering with other detectors such as refractive index (RI), ultraviolet (UV) and intrinsic viscosity (IV) to generate a large amount of information about a sample simultaneously.
In this application note, molecular weight data from the Viscotek SEC-MALS 20 is combined with measurements of Rg and IV to study the structure of different polysaccharides including pullulan, dextran, hydroxypropyl cellulose (HPC), pectin and gum Arabic. The differences between conformation and Mark-Houwink plots are also studied.
|
The SEC-MALS 20 detector was connected to a Viscotek GPCmax and a Viscotek TDA system. Samples were separated using 2 x Viscotek A6000M columns (Dextran, Pectin, Gum Arabic) or one column (Pullulan, Hydroxypropyl cellulose). The mobile phase was phosphate buffered saline. The SEC-MALS 20 system was calibrated with a 19kDa PEO standard. The detectors and columns were all held at 35°C to ensure a good separation and maximize baseline stability.
All samples were dissolved in mobile phase to a concentration of between 0.5 and 3 mg/ml and a 100µl injection volume was used. The dextran sample has a known molecular weight and was used to check the calibration. All samples were allowed to dissolve overnight to ensure full dissolution.
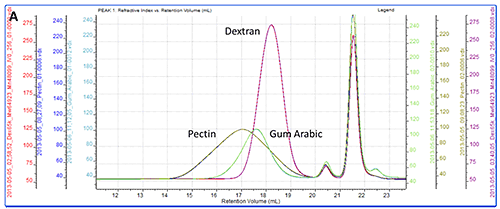
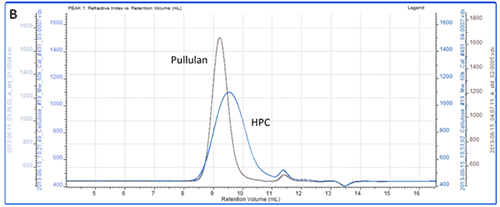
All of the samples were successfully separated on the system. Overlaid RI chromatograms are shown for the pectin, gum Arabic and dextran (figure 2A) and for the pullulan and HPC (figure 2B).
|
|
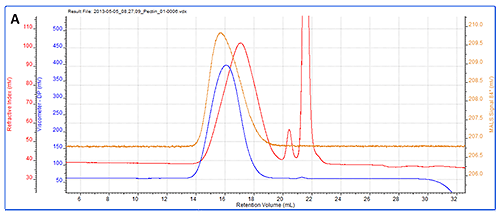
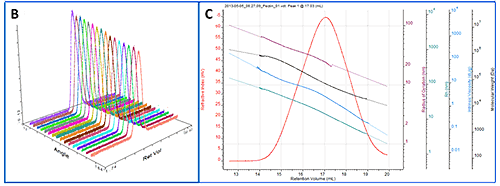
As a more detailed example, a chromatogram of pectin is shown in figure 3A showing the RI, LS (90°) and IV detectors. Figure 3B shows the angular data from the SEC-MALS 20 detector. A slight angular dependence can be seen across the different angles allowing Rg to be measured for this sample. Figure 3C shows the RI peak overlaid with the measured molecular weight, Rg, IV and Rh.
|
|
| Sample Id | Dextran | Pectin | Gum Arabic | Pullulan | HPC | |||||
|---|---|---|---|---|---|---|---|---|---|---|
| Injection | 1 | 2 | 1 | 2 | 1 | 2 | 1 | 2 | 1 | 2 |
| Mn - (kDa) | 51.42 | 51.56 | 51.07 | 52.40 | 292.81 | 291.42 | 185.77 | 187.28 | 61.86 | 58.06 |
| Mw - (kDa) | 63.18 | 63.34 | 115.07 | 115.89 | 515.13 | 519.06 | 196.57 | 197.49 | 83.03 | 81.86 |
| Mz - (kDa) | 77.84 | 78.29 | 249.56 | 252.81 | 974.47 | 1,000.00 | 210.70 | 210.47 | 118.79 | 125.51 |
| IV - (dl/g) | 0.256 | 0.256 | 3.671 | 3.689 | 0.158 | 0.156 | 0.674 | 0.678 | 1.050 | 1.066 |
| Rh - (nm) | 6.06 | 6.07 | 16.97 | 17.06 | 10.26 | 10.21 | 16.63 | 16.70 | 13.98 | 13.93 |
| Rg - (nm) | 7.55 | 7.09 | 25.83 | 25.98 | 8.08 | 8.55 | 16.42 | 16.58 | 22.48 | 20.03 |
Table 1 summarizes the results for the different samples. Duplicate injections were performed and it can be seen that the repeatability between injections is excellent across all of the measurements.
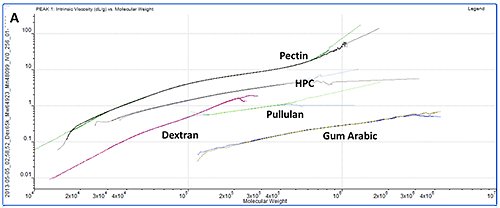
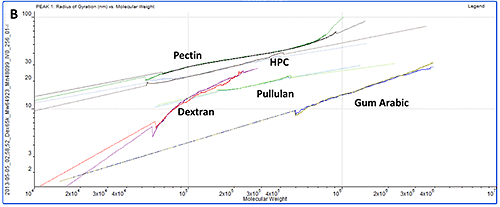
While study of the numerical results is an excellent quantitative way to compare samples, plotting the data on Mark-Houwink and Conformation plots is an ideal way to compare samples quickly from a visual perspective. A Mark-Houwink plot displays intrinsic viscosity as a function of molecular weight whereas a conformation plot shows Rg as a function of molecular weight. Both of these are therefore a way of visualizing the increase in size as molecular weight increases. They allow immediate comparison of different samples with respect to each other and are ideally suited to the study of branching and other structural changes. In this case though, we are just interested in seeing where the different polysaccharides fall on the plots.
|
|
The information contained within the results becomes immediately clear when studying the Mark-Houwink and the Conformation plots. While gum Arabic is the highest molecular weight sample, it is also the 'lowest' on both plots indicating that for its mass, it is the smallest (conformation plot) or most dense (Mark-Houwink plot) of the molecules under study. Although primarily a polysaccharide, gum Arabic is usually associated with a protein component which adds mass with only a small increase in size so this is as expected.
On the other hand, pectin has the longest line in both plots indicating that this is the most polydisperse molecule of the ones studied. This is in agreement with the fact that it also had the widest peak in the chromatogram. This is clearer on the Mark-Houwink plot than on the Conformation plot. Since it shows Rg, the Conformation plot is limited to molecules over approximately a 10nm radius where the light scattered by the samples is anisotropic. The pectin distribution includes some material that is below this threshold where Rg cannot be measured. IV is not limited by size so can measure across the entire molecular weight distribution. As the 'highest' molecule on both plots, pectin identifies itself as the largest (Conformation plot) and least dense (Mark-Houwink plot) molecule of those under investigation.
HPC, pullulan and dextran all fall in between the pectin and gum Arabic samples indicating that their structures are somewhere between these two extremes.
While the two plots give similar information, it is worth noting that each has strengths and weaknesses that will make their appropriateness application dependent. As discussed above, the Conformation plot cannot be used for smaller molecules. However, as a direct measure of size, it is not dependent on any shape models. If IV is to be converted into a size value, some shape model must be assumed, as in the calculation of Rh in table 1.
In summary, in this application note, the molecular weight, size and intrinsic viscosity of a selection of polysaccharides were measured using the Viscotek TDA and SEC-MALS 20 systems. Conformation and Mark-Houwink plots were then drawn which both clearly demonstrate the different structures between the different samples. From the data, the differences in molecular structures between the different polysaccharides are very clear and can be easily observed.
This level of characterization was not previously possible with single-detector GPC systems. The use of light scattering and intrinsic viscosity detectors in conjunction with GPC allows detailed characterization of natural and synthetic polymer samples.