
Microplastics, usually defined as pieces of plastic that are less than 5mm in size, are a global environmental and potential health issue. They can be released directly from the production or use of consumer products (primary microplastics), or from the fragmentation of larger plastic objects (secondary microplastics). Geographically microplastics are present everywhere on Earth1 and have pervaded our food chains2 and our drinking water3. Though the term “microplastics” was coined in 2004, the increased media coverage of recently published studies meant that 2018-19 was really a wake-up call to the general public about the issues with microplastics. A 2014 study estimated that there was between 15 and 51 trillion microplastic particles floating in the world’s oceans, weighing between 93 and 236 thousand metric tons4.
Visual inspection, either by eye or using manual microscopy, is still one of the most widely used methods to identify and quantify microplastics. It is however subjective, time-consuming and very susceptible to user bias, with non-plastic material often being mis-classified as microplastics. To help overcome this, chemical identification using non-destructive techniques such as Raman spectroscopy is increasingly being used to aid microplastic analysis1.
Using Morphologically-Directed Raman Spectroscopy (MDRS®), individual microplastic particles can be automatically and independently characterized within a mixture, providing complimentary particle size, shape and chemical ID information. From this component specific information can be obtained i.e. the particle size and shape distributions for each different type of microplastic present in the sample, in a single automated measurement. This application note explores the use of MDRS on the Morphologi 4-ID to characterize and identify a mixture of six types of microplastic collected on a membrane filter.
A 2 mL aliquot of an aqueous suspension containing six different plastics (listed in Table 1 along with some of their common uses) was vacuum filtered using glassware to avoid plastic contamination. The microplastic particles were collected on a 47 mm mixed cellulose ester membrane filter, which was then transferred to the Filter Plate accessory (see Figure 1) and allowed to dry overnight.
| Plastic Type | Abbreviation | Common Uses |
|---|---|---|
| Polyethylene Terephthalate | PET | drinks bottles and food packaging, clothing |
| Polyethylene | PE | packaging (plastic bags and films) |
| Polypropylene | PP | rigid packaging, plastic parts, labels |
| Polystyrene | PS | packaging, foams, disposable food containers |
| Polyvinyl Chloride | PVC | pipes, credit cards, wire insulation |
| Polycarbonate | PC | construction materials, discs (e.g. DVDs) |
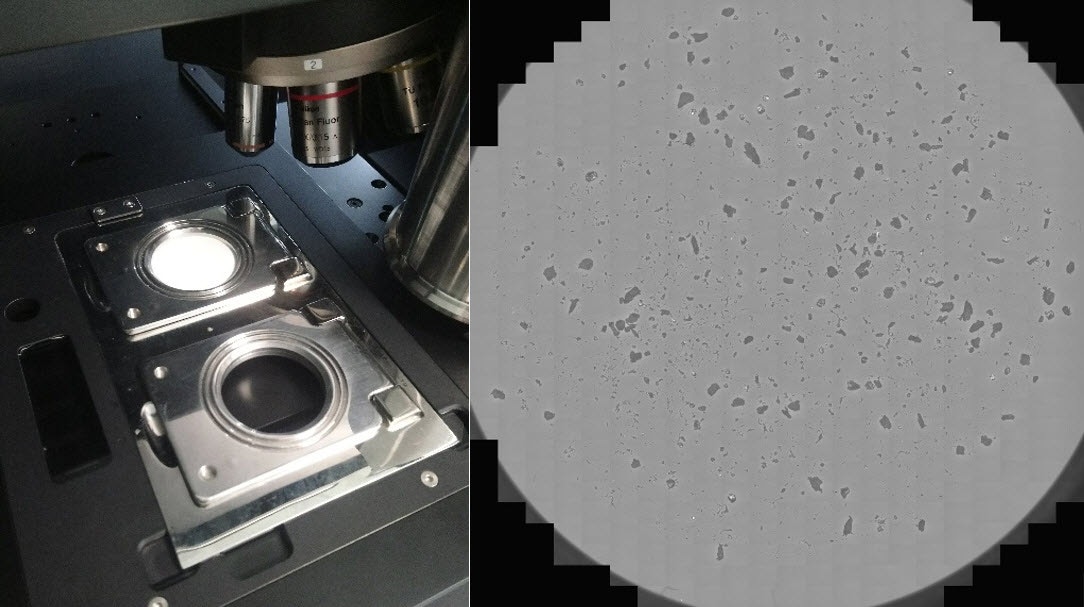
Figure 1: Photograph of the Filter Plate holding the membrane filter to be measured on the Morphologi 4-ID stage, and the composite scan area of the filter at 2.5x magnification
The Filter Plate was mounted on the Morphologi 4-ID stage and analyzed using MDRS. This technique is a fully automated procedure whereby the sample is first scanned in order to characterize the particle morphologies and record their locations, followed by returning to a subset of the particles to chemical identify them using the integrated Raman spectrometer. During set up particle classes can be created to define which particles will be targeted for Raman spectral acquisition.
An 18 mm radius circular scan area was scanned at 2.5x magnification. Dual thresholding was used to capture both dark and reflective particles; the composite image of the scan area can be seen in Figure 1. For this analysis 500 particles with a size of 100 µm or greater were then targeted for Raman chemical identification with a spectral acquisition time of 10 seconds at 100% laser power. A further MDRS measurement was then performed at 10x magnification to target particles in the 20 to 100 µm size range.
A reference library was created by acquiring spectra from discrete samples of the six plastic types using the Morphologi 4-ID. During the MDRS analysis every particle spectrum was correlated to the spectral reference library, giving a correlation score between 0 and 1 – the more similar a particle spectrum is to the library component, the closer the correlation score is to 1. Typically, a threshold value is defined where the user has confidence that chemical components can be differentiated.
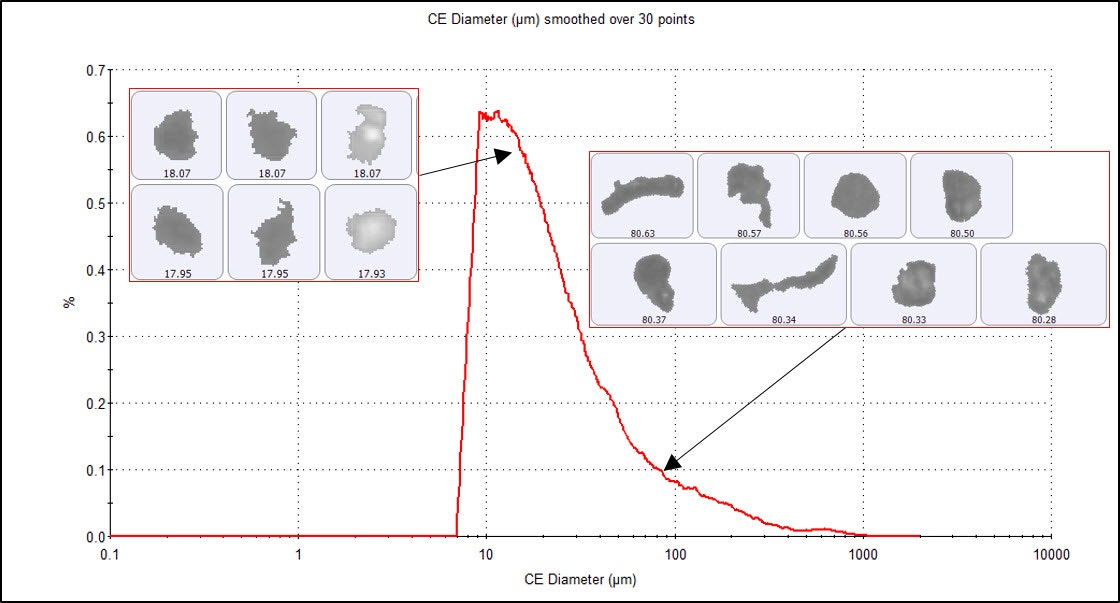
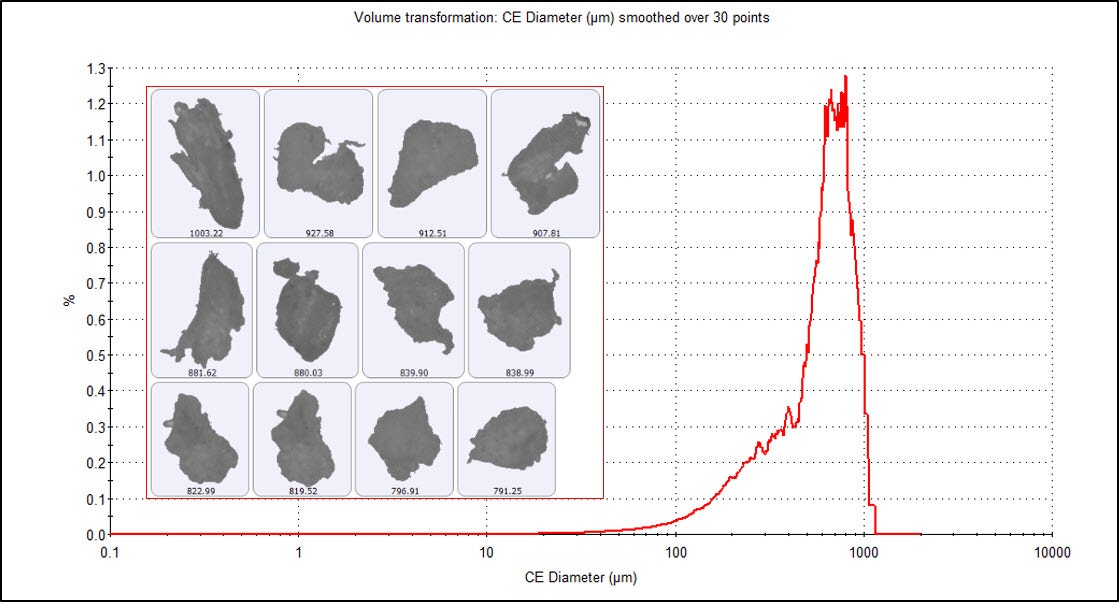
Figures 2 and 3 show the number and volume weighted Circle Equivalent Diameter (CED) distributions, respectively, for the microplastic particles imaged on the membrane filter at 2.5x magnification. The distributions reveal that the sample was very polydisperse, with particle sizes ranging from smaller than 10 µm up to 1 mm. The fine material is much more obvious in the number-based distribution (where each particle is counted equally), while the volume weighted distribution (where a single 100 µm particle has the same contribution as one thousand 10 µm particles) emphasizes the large microplastic particles.
Raman spectra acquired on a subset of the imaged particles with a size of 100 µm or greater were classified based on the library spectrum to which the spectra gave the best correlation while also meeting a threshold value (see Figure 4). Due to the nature of the sample analyzed the reference library only contained the Raman spectra of plastics, but the Morphologi 4-ID can also be used to differentiate between plastic and non-plastic particles such as natural materials like sand or cellulose.
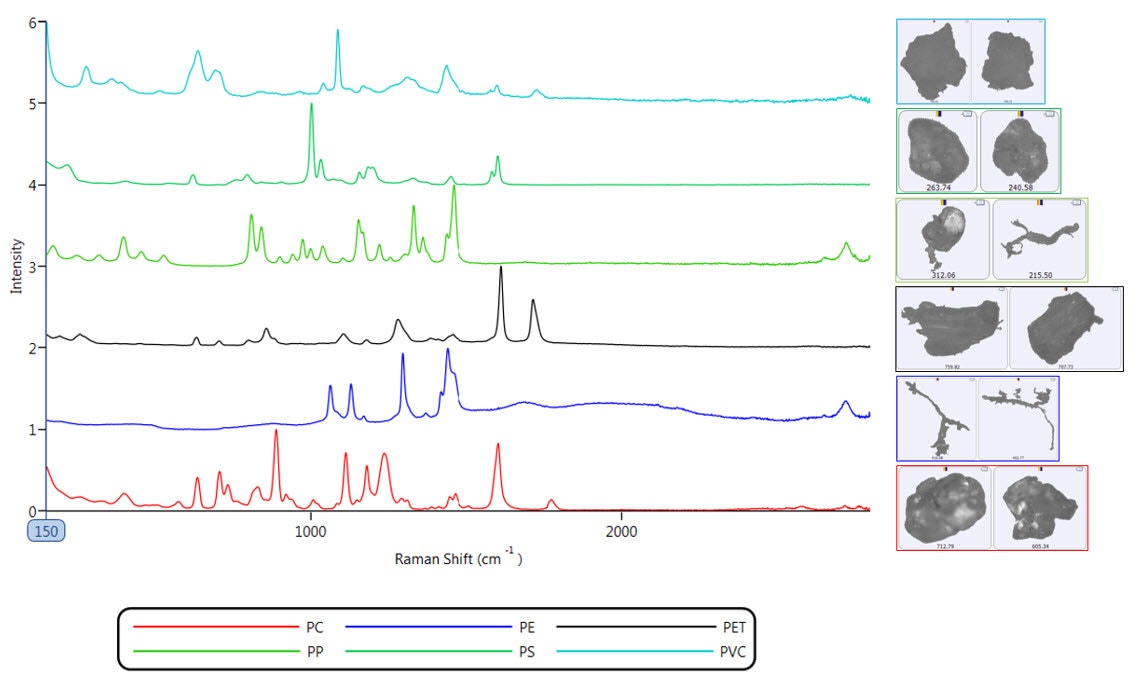
Figure 4: Raman spectra of PE, PP, PS, PC, PET and PVC acquired on the Morphologi 4-ID, with example images of chemically identified particles of each plastic in the filtered sample
From the chemically identified particles a chart showing the percentage count of total classified particles for each plastic type was plotted (Figure 5). This shows that the most abundant microplastic particle type above 100 µm in size on the filter was PET (39%), followed by similar numbers of PE (27%) and PS (26%) particles, with the remaining 8% comprised of the other three plastic types.
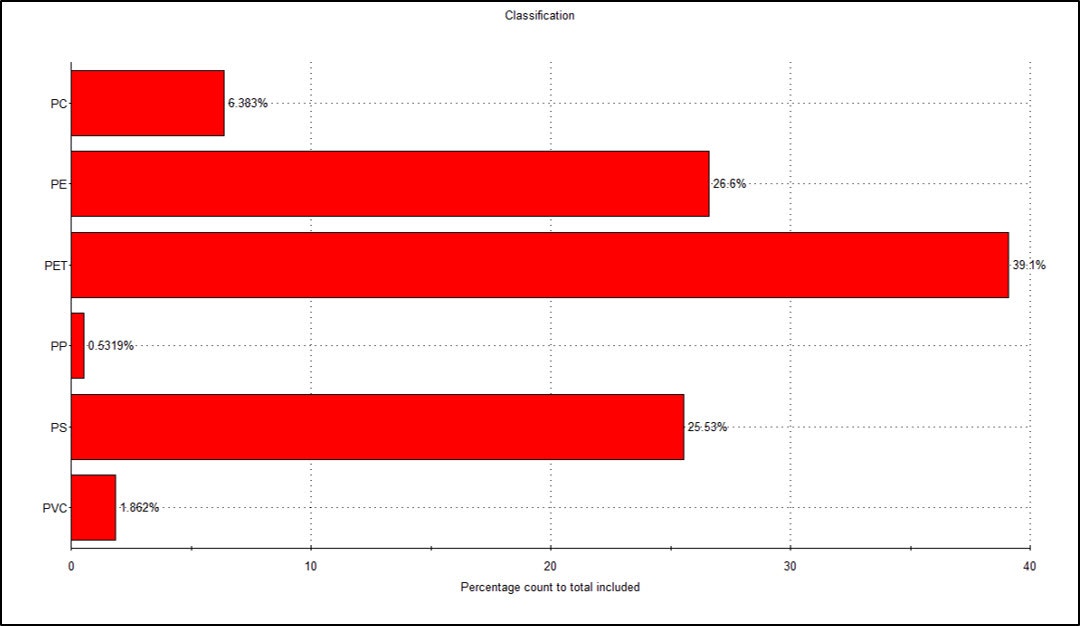
Figure 5: The percentage of total counted particles for each plastic type identified by Raman spectroscopy (CED ≥ 100 µm)
By using MDRS it has become possible to look at and compare the particle size and shape distributions for each type of plastic in the microplastic sample. Figure 6 shows the circularity distribution for the three most abundant plastic types; PET, PE and PS, along with example particle images. The plastic particles are typically irregular in shape, with the PE particles showing much lower circularity values. This reflects the PE particle images which appear to be mostly fibrous in nature.
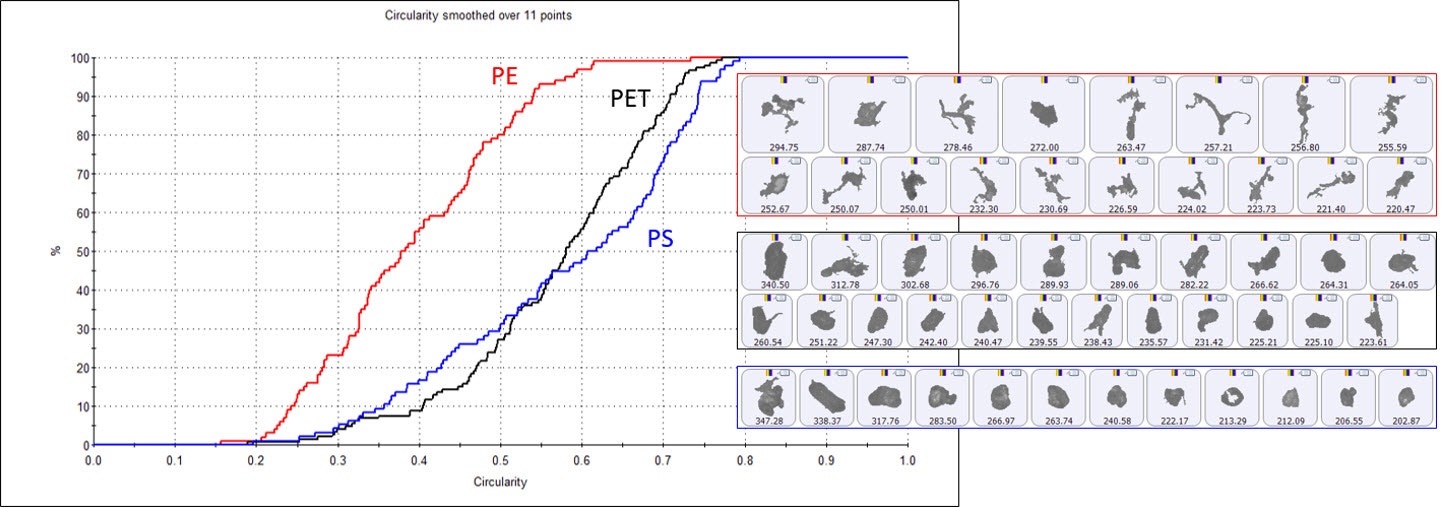
Figure 6: Circularity undersize distributions for the microplastic particles identified as PE (red), PET (black) and PS (blue) using MDRS with example particle images with a CED ≈ 250 µm for each plastic type
The second MDRS measurement targeted particles sized between 20 and 100 µm. Figure 7 compares the percentage count of total classified particles for each plastic type for both size ranges analyzed and shows high similarity. Being able to easily compare classified data sets, whether they are measurements from many different samples or even of the same sample, as shown here, can aid the rapid assessment of real processes. For instance, it could be used to compare the type and morphology of microplastics collected from different locations over several size bands, or used to track erosion rates and behaviors of different polymer types when subjected to a particular environment or treatment.
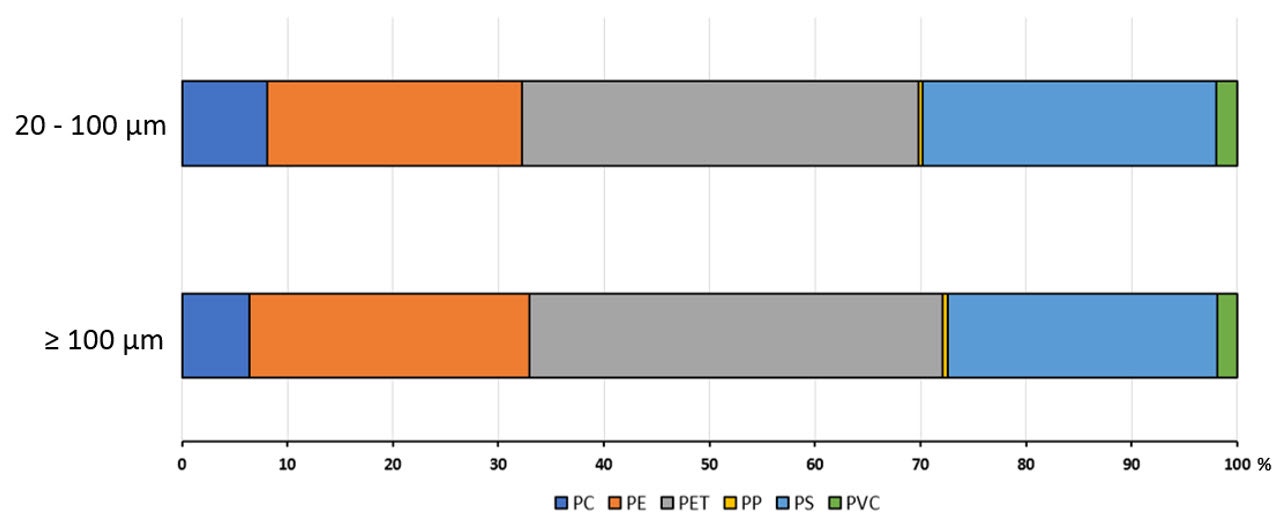
Figure 7: The percentage of total counted particles for each plastic type identified by Raman spectroscopy in the 20 - 100 and ≥ 100 µm size ranges
With laboratories and teams all over the world currently carrying out varying research into the origins, impact and fate of microplastics in the environment, the combination of automated particle size and shape analysis and chemical identification using Morphologically-Directed Raman Spectroscopy (MDRS) is well placed to facilitate the analysis of samples containing microplastics. This application note shows that using the Morphologi 4-ID allows the sizes, shapes and proportions of several types of microplastic particles to be measured, improving the understanding of the likely behavior of these materials in a process or environment, and allowing samples from different locations to be easily compared.