
XRD can be used for fast and accurate cluster analysis, phase identification and quantification of the minerals present in iron ore. The ore contains phases as hematite, goethite and magnetite as well as the gangue minerals gibbsite Al(OH)3, kaolinite Al2Si2O5(OH)4 and quartz SiO2. In addition, different XRD methods can distinguish between goethite with varying Al contents.
Theoretical grade blocks can be defined on the basis of the mineralogy determined by XRD, indicating ore grades that can be effectively and economically upgraded in the concentrator.
Exploration of iron ore deposits can be done using cluster analysis. This method can distinguish between different ore grades and facilitate multidimensional compositional mapping of ore deposits. Cluster analysis identifies regions of favorable mineral compositions without detailed knowledge about the phase content.
Beneficiation techniques for iron ore are receiving worldwide attention due to the development of new deposits of lower grade ore. This application note describes the benefits of resolving the mineralogical ore composition by use of X-ray diffraction (XRD) in order to optimize concentrator feed and operational efficiency.
Minerals such as gibbsite and kaolinite show different properties during the beneficiation process. Gibbsite as well as aluminous goethite cannot be removed from the ore and must be controlled by blending with low-Al containing material. However, kaolinite can be liberated during wet concentration to increase the quality of the ore.
The minerology exploration of ore samples is often not considered or at best inferred from visual geological logging of the sampled material. As such, mineral contaminants that cannot be identified visually and / or by chemical analysis alone are often not quantified.
For example the identification of gibbsite via chemical data is typically problematic due to the co-occurrence of kaolinite and aluminous goethite. The correct identification of gibbsite is important as gibbsite can have a significantly adverse impact on sinter efficiency of the iron ore. Gibbsite-bearing ores require longer sintering times and higher sintering temperatures in order to promote melt formation.
Information provided by XRD gives the mine geologist the opportunity to create maps of the spatial distribution of minerals such as gibbsite or kaolinite (see Figure 1) and provides the possibility to blend and / or isolate these minerals throughout the defined grade blocks.
Figure 1. Contour plots showing the distribution of kaolinite and gibbsite for one iron ore deposit, Western Australia (Paine et al. 2011), 60 samples measured
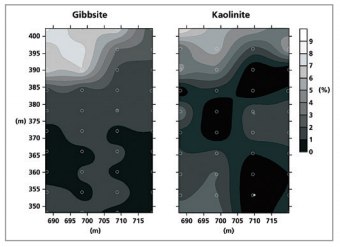
Figure 2. Original (A) and revised (B) grade blocks defined on the basis of varying mineralogy, see also Figure 6, for one iron ore deposit, Western Australia (Paine et al. 2011)
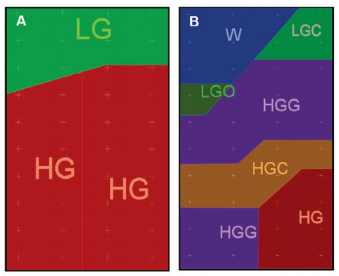
In this example theoretical grade blocks could be redefined on the basis of the XRD data (Figure 2). In comparison with the original high-grade blocks domain (Figure 2A) the revised high grade blocks could be separated into three different classes; high grade (HG), high-grade gibbsite (HGG) and high grade beneficiation (HGC) (Figure 2B).
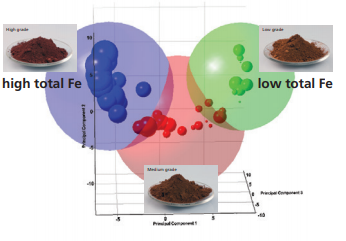
Cluster analysis can be used to simplify data processing significantly by automatically sorting closely related scans into clusters. The amount of data that has to be processed in order to characterize each cluster is drastically reduced this way. In this case study, all 60 scans of different iron ore samples were clustered. A principal component analysis (PCA) plot was calculated, as can be seen in Figure 3. Each circle represents one scan which stands for one iron ore sample, respectively. The size of the circles represents the total iron content. Three different clusters are found with around each cluster displayed semi-transparent confidence spheres. The shape of the PCA plot indicates the presence of a complete range of ore grades.
The PCA plot was modified in order to display one additional property of the data sets as can be seen in Figure 3. The total Fe content, determined by XRF analysis, is plotted as circles with different sizes. Big circles indicate high Fe content (blue) and the small circles indicate low Fe content (green).
Both high- and low-grade beneficiation (LGC) feed have been defined on the basis of relatively high kaolinite content making these blocks amenable to beneficiation. Low-grade other (LGO) comprises relatively low kaolinite material which is not readily amenable to traditional forms of beneficiation. Waste (W) are grade blocks with a very low total iron content (Paine et al. 2011).
Figure 3. Principal component analysis (PCA) plot of 60 iron ore samples divided into 3 different clusters (grades) with different mineralogy, displaying semi-transparent confidence spheres around each cluster
Modern methods like the Rietveld refinement in combination with high-speed data collection allow for fast and reliable quantification of iron ores. The full pattern Rietveld method has several advantages compared to classical quantification methods. All crystalline phases can be quantified in just a few seconds without line overlaps, sample height and preferred orientation influencing the results. No standards, monitors or calibration are needed.
Figure 4 shows the graphical output of a Rietveld refinement of one typical iron ore sample. The difference plot highlights the fit between the measurement and the profile calculated by the software.
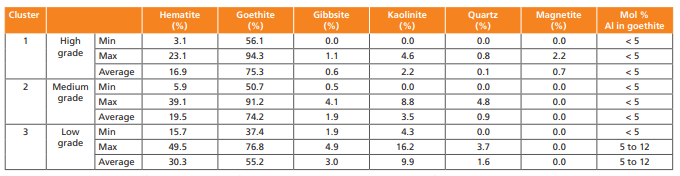
During the Rietveld quantification crystallographic parameters such as unit cell dimensions and occupation factors are calculated. These parameters can be used to identify goethite with different Al contents as shown in the last column of Table 1. Within the crystallographic structure of goethite, the Fe atoms can be substituted with Al atoms up to 30 mol%.
All 60 samples were analyzed and quantified. The concentration ranges for the different grades correlate with the three clusters as demonstrated in Figure 5. The three ore grades specified are distinguished by the goethite content and the concentration of the Al-containing phases. The hematite content does not vary significantly between the three grades. Quantitative results are summarized in Table 1 showing the minimal, maximal and average mineral concentrations.
Figure 4. Rietveld refinement of the same iron ore sample as in Figure 3 (red = measurement, blue = calculation; below = difference plot, RProfile = 3.7 (mathematical quality of the fit))
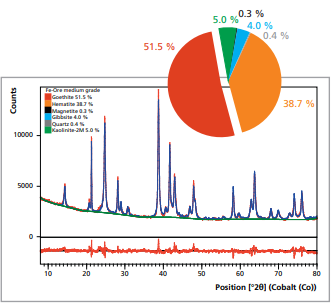
Figure 5. Phase concentrations goethite, kaolinite and gibbsite versus the cluster number of 60 iron ore samples
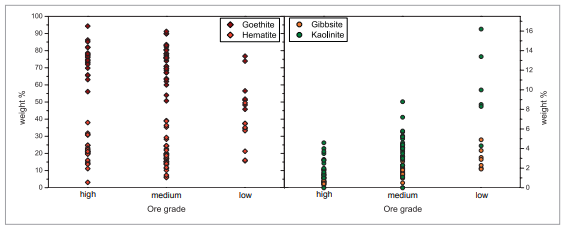
Table 1. Concentration ranges of the phase content of 60 iron ore samples obtained by Rietveld refinement
For this study sixty iron ore samples from one deposit in Western Australia (WA) were analyzed. The grain size of iron ore is far too large for direct analysis. Samples were, therefore, ground and pressed with a compact sample preparation machine into steel ring sample holders. Sample handling and preparation are critically important for reliable phase quantification. It is recommended that a standardized or automated sample preparation procedure is used.
Configuration and measurement conditions
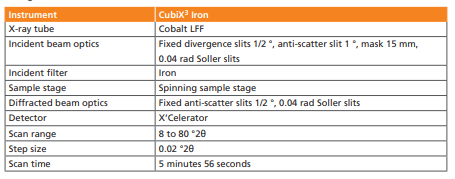
The measurements were made using a CubiX3 Iron industrial diffractometer, suitable for all types of iron-containing samples. A cobalt tube with incident beta filter (Fe) is especially suited for iron-containing materials, as it produces high-resolution data without disturbing sample fluorescence. The measurements can be done in less than 6 minutes using a high-speed X’Celerator detector.
Rapid XRD analysis and associated cluster analysis offer additional criteria for the definition of grade blocks in iron ore mining and have advantages compared with other definitions that are only based on chemistry. The additional information, such as the concentration and spatial distribution of gibbsite, aluminous goethite and kaolinite provide the mine geologist with the possibility to blend and/or isolate these minerals throughout the defined grade blocks.
In addition, material with a tendency for higher degrees of beneficiation can be identified and domained. Conversely, material with limited upgrade potential can be identified without submitting it to traditional forms of beneficiation. In sum, the use of XRD with its modern optics, high-speed detectors and software provides rapid and accurate mineral analysis suitable for process control environments and can increase operational efficiency.