In this data sheet it is demonstrated that SAXS measurements performed on our multipurpose XRD platforms allow to easily determine particle size distributions and specific surface areas of colloidal quantum dots and to probe for the presence of aggregates.
SAXS measurements on dilute dispersions of CdS quantum dots in toluene were performed on the Empyrean multipurpose XRD platform. A good data quality could be obtained, which allowed a consistent data analysis with the EasySAXS software to determine the size distribution and the specific surface area of the nanoparticles.
Semiconductor nanoparticles, also known as quantum dots, have peculiar optical and electronic properties that strongly depend on the size and shape of the particles. At particle sizes below 10 nm the band gap increases with decreasing size (quantum confinement effect). Colloidal synthesis of quantum dots allows to tune the particle size so as to achieve the desired property. Quantum dots are of high interest for applications e.g. in LEDs, solar cells and in biology for cellular imaging. In this data sheet it is demonstrated that SAXS measurements performed on the Empyrean platform allow to easily determine particle size distributions and specific surface areas of colloidal quantum dots and to probe for the presence of aggregates.
Colloidal CdS quantum dots with a concentration of 0.5 wt.% (5 mg/ml) in toluene were purchased from Aldrich and used as received. A small amount of the sample was transferred in a disposable 1 mm quartz capillary. SAXS measurements were performed on the Empyrean platform equipped with a copper X-ray tube in line-focus orientation, ScatterX78, a focusing mirror and the PIXcel3D detector used in 1D mode. The beam path was evacuated to minimize air scattering. Typical measurement times are in the order of a few minutes. Alternatively, with longer data collection times, such measurements could also be done with a SAXS setup in air when using a 0D detector in combination with suitable anti-scatter devices.
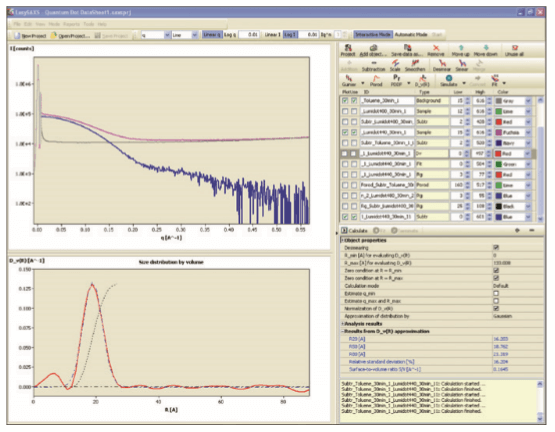
Shown in the top graph on the right side are the measurement results of the actual sample (colloidal dispersion) and of the corresponding background (pure dispersion medium).
The background-corrected data, representing the scattering signal due to the quantum dots, were analyzed by an indirect Fourier transformation procedure to determine the (volume- weighted) particle size distribution. Here the particle shape was assumed to be spherical. The average particle radius Ravg could thus be determined to 19 Å and the size polydispersity (width of the distribution relative to the average radius) to 16 %. The surface-to-volume ratio S/V of the particles was found to be 0.165 Å-1. From this the specific surface area is calculated to 342 m2/g, assuming a mass density of 4.83 g/cm3 for CdS.
Screen grab of the EasySAXS data analysis software
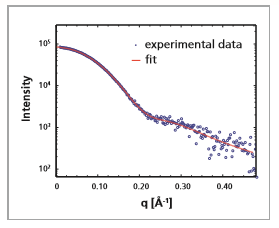
The graph on the underneath shows the experimental data together with the curve that was obtained from the back-transformation of the particle size distribution curve. Both curves are in good agreement, demonstrating the good fit of the model.
Whereas for the particle size distribution determination it was assumed that the particles have a spherical shape, it is also possible to apply model-independent data analysis to derive a particle size parameter and S/V by applying the basic principles of SAXS. As demonstrated below, this allows to do a consistency check of the results.
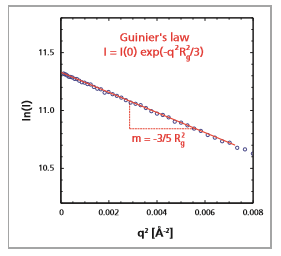
The initial curvature of the background-corrected scattering data was analyzed using a Guinier plot (ln(I) vs. q2) to determine the radius of gyration Rg which may be seen as a model-free particle size parameter. The data follow a straight line in this plot and from the slope Rg could be calculated to 16 Å, which is in good agreement with the Ravg determined by indirect Fourier transformation (for spheres by theory Rg2 = 3/5 R2). From the finding that the data follow Guinier’s law down to the smallest scattering angles it can be concluded that the quantum dots are finely dispersed in the dispersion medium and do not aggregate. Aggregation effects would be evidenced by an upturn of the scattering intensity at the smallest angles, relative to the straight line.
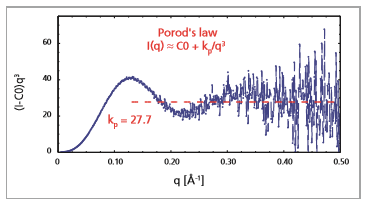
The final slope of the scattering curve was found to follow Porod’s law: the scattering intensity, corrected for a small background constant C0, for slit-smeared data decays with the third power of the scattering vector q. Consequently, in the Porod plot the scattering intensity levels off at a constant value, which is known as the Porod constant kp.
As the experimental data follow Guinier’s law at the smallest angles and Porod’s law at the higher angles, it is possible to extrapolate the data to zero as well as to infinite scattering vectors q. The integral scattering intensity, expressed by the scattering invariant Q, may then be calculated from the first moment of the scattering curve. The surface-to-volume ratio S/V of the quantum dots can then be determined from the ratio of the Porod constant kp and the scattering invariant Q, even when experimental data are not available on an absolute intensity scale. In this example a value of 0.187 Å-1 was obtained, which is consistent with the value deduced from the particle size distribution.
SAXS data from dilute colloidal dispersions of quantum dots can be readily measured in situ on the Empyrean platform, either using ScatterX78 with an evacuated beam path, or with a more economical setup in air. Sample preparation is minimal and results can be obtained within short measurement times. The EasySAXS data analysis software among others allows to determine the size distribution and the surface-to-volume ratio of the nanoparticles, the radius of gyration by a Guinier analysis, and enables to check for the presence of aggregates. Porod analysis and determination of the scattering invariant are also supported. By applying these data analysis options, the internal consistency of the results could be demonstrated.