
The intention of this datasheet is to demonstrate the improved performance of the fused bead method compared to pressed powder analysis.
The analysis of pressed pellets and loose powders presents limitations in precision, due to severe metallurgical as well as particle size effects. To overcome this, Malvern Panalytical has developed an application for the analysis of ferroalloys (in particular for FeSi), prepared as fused beads. To overcome this, Malvern Panalytical has developed an application for the analysis of ferroalloys (in particular for FeSi), prepared as fused beads. By doing so, metallurgical and particle size effects are removed. Compared to classic methods, results are equivalent or better in accuracy and precision.
Ferroalloys are important components in metals production with iron and steel smelters as the leading customers of ferroalloys. Ferrosilicon (FeSi) is one of the most widely used ferroalloys with a high consumption rate. It is primarily used as source of silicon, where the Si content varies from 15 to more than 90%, affecting the final purchase price. Currently, ferrosilicon analysis is conducted by wet-chemical methods, with subsequent large delays and high labor costs. X-ray fluorescence (XRF) spectroscopy is an excellent alternative technique, offering easy routine sample preparation and high throughput. However, the analysis of pressed pellets and loose powders presents limitations in precision, due to severe metallurgical as well as particle
size effects. To overcome this, Malvern Panalytical has developed an application for the analysis of ferroalloys (in particular for FeSi), prepared as fused beads. By doing so, metallurgical and particle size effects are removed. Compared to classic methods, results are equivalent or better in accuracy and precision. The intention of this data sheet is to demonstrate the improved performance of the fused bead method compared to pressed powder analysis.
This study was performed using a Zetium wavelength dispersive XRF spectrometer. It was configured with a 4 kW Rh anode, SST R-mAX tube and is a fully integrated system with an X-Y sample handler and state-of-the-art SuperQ software, featuring an advanced Fundamental Parameters algorithm. Zetium is engineered for excellence in terms of analytical accuracy, precision and operational performance.
10 certified FeSi reference materials (CRM) from different standardization bureaus were used to set up a calibration for the analysis of major and minor elements. For comparison purposes, samples were prepared as pressed pellets as well as fused beads. Pressed pellets of Ø32 mm were prepared by mixing 10 g of CRM with 1 g of binder and finally pressed at 20 tons for 30 seconds in Al cups. Fused beads of Ø32 mm were prepared by mixing 0.2 g of CRM with oxidizing agents and finally fused with lithium borate flux using an Eagon 2 automatic fusion machine. While the original recipe was developed for FeSi, the program has meanwhile been extended to cover FeSiCr, FeSiMn, SiMn and SiCa alloys as well. For each sample, 11 elements were measured in
14 minutes using a 27 mm collimator mask. Two FeSi CRMs were used as control samples to evaluate the calibration. Results of sample preparation and measurement repeatability are shown in the sample preparation with Eagon 2 datasheet.
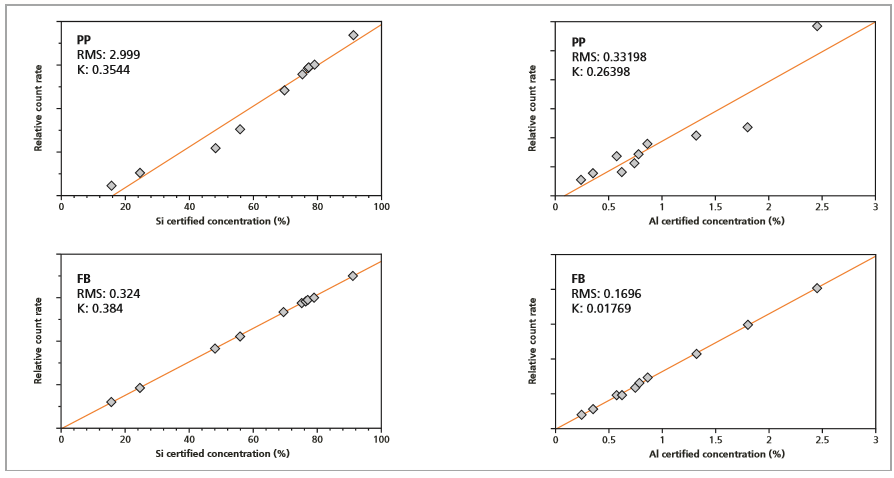
The measurements performed on a Zetium spectrometer show very good results for all major, minor and trace elements analyzed. Figure 1 shows calibration lines for Si and Al, obtained for pressed pellets and for fused beads, each reporting its K value. Table 1 gives an overview of the elements with their concentration range, their respective value for the ‘root mean square’ (RMS) error, K factor and the lower limit of detection (LLD) for fused beads, based on 100 s counting time. The RMS (absolute error) and K (relative error) represent the accuracies of the calibration. The K factor is a weighted residual error and is a measure of the differences between the measured concentration and the supplied, certified chemical concentration:
Where C0 is a concentration, generally taken as 0.1% mass percentage, n is the number of standards used in the calibration and k is the number of constants calculated (e.g. intercept, slope, line overlap). As a general rule, K factors ranging from 0.01 to 0.05 indicate accurate calibrations.
Table 1. Calibration parameters: values for ‘root mean square’ (RMS), K factor and lower limit of detection (LLD)
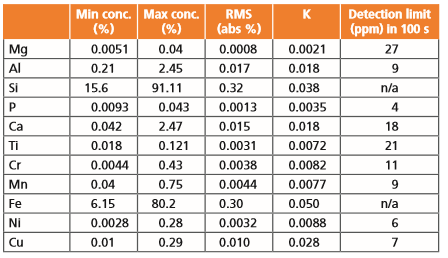
Figure 1. Calibration graphs for Si and Al: comparison between pressed pellets (PP) and fused beads (FB)
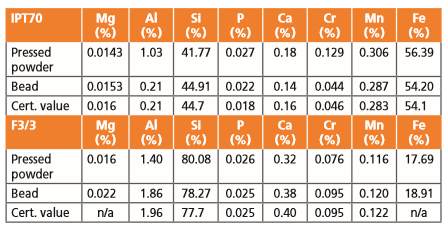
To validate the calibration results, two certified reference materials were used as control samples. Each sample was prepared and measured as a pressed pellet and fused bead. Results are reported in Table 2. The comparison between pressed pellets and fused beads shows higher accuracy of measurements for the latter with respect to certified values. Results shown in this data sheet are normalized after taking into account that the carbon concentration was measured using a combustion gas analyzer.
Table 2. Results of control samples vs certified values
This study demonstrates that results obtained for ferrosilicon alloys using Zetium and the fused bead method, are more accurate than those obtained on pressed pellets. Compared to classic analytical methods, XRF offers a competitive advantage with short throughput time (can be lowered down to about 4 minutes), making the Zetium highly suitable to be used in process control, especially in combination with the Eagon 2 fusion machine.