This work demonstrates the analytical capabilities of the Epsilon 1 to measure a range of compounds found in glass. Glass and its precursor raw materials are commonly measured using X-ray fluorescence (XRF) for process control. As glass is normally very homogeneous, sample preparation will not be needed or otherwise a simple polishing step is sufficient. Three different measuring times were used to demonstrate the typical precisions that can be obtained with Epsilon 1 for soda glass analysis.
The results display the capabilities of the Epsilon 1 for the analysis of major, minor and trace compounds in soda glass.
Precision in XRF can be managed through the selection of measuring time. These data demonstrate the typical precision that can be obtained on this instrument with a selection of different measuring times.
This work demonstrates the analytical capabilities of the Epsilon 1 to measure a range of compounds found in glass. Glass and its precursor raw materials are commonly measured using X-ray fluorescence (XRF) for process control. As glass is normally very homogeneous, sample preparation will not be needed or otherwise a simple polishing step is sufficient. Three different measuring times were used to demonstrate the typical precisions that can be obtained with Epsilon 1 for soda glass analysis.
Measurements were performed using an Epsilon 1 EDXRF spectrometer, equipped with a 50 kV silver-anode X-ray tube, six filters and high-resolution silicon drift detector. The data were automatically processed by the Epsilon 1 software.
A series of in-house calibration standards, in the form of microscope glass slides, were provided by an international glass manufacturing company. An additional pure silica disk was added next to the standards to act as a blank in the calibration graphs. The standards had all been polished and were cleaned with isopropanol and measured directly for calibration.
The measurement conditions that were used to set up the calibration are displayed in Table 1. Six different measurement conditions were used, each one optimizing the excitation of a group of elements. A representative XRF spectrum for Na and Mg in a microscope glass slide, using the <Na-Si> condition, is shown in Figure 1. The total measurement time was 25 minutes per standard.
| Condition | kV | μA | Filter | Meas. time (s) | Elements |
|---|---|---|---|---|---|
| <Na-Si> | 10 | 293 | None | 400 | Na, Mg, Al, Si |
| <P-Cl> | 10 | 500 | Ti | 60 | P, S, Cl |
| <K-V> | 12 | 416 | Al-thin | 90 | K, Ca, Ti |
| Cr-Co> | 20 | 250 | Al-thick | 800 | Cr, Mn, Fe |
| <Ni-Mo> | 50 | 100 | Ag | 60 | Sr, Zr |
| <Rh-Sb> | 50 | 100 | Cu-thick | 60 | Sn |
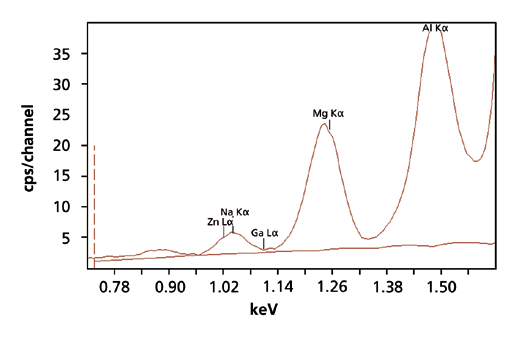
Figure 1. XRF spectrum of Na and Mg in a microscope soda glass slide, measured with the <Na-Si> condition
Figure 2 shows the calibration graph for Fe2O3 in the soda glass slides. The graph shows a good correlation between the certified concentrations and the measured intensities. Detailed calibration results for all 16 compounds are summarized in Table 2. The correlation coefficient and RMS (root mean square), equal to 1 sigma standard deviation, is included in the table.
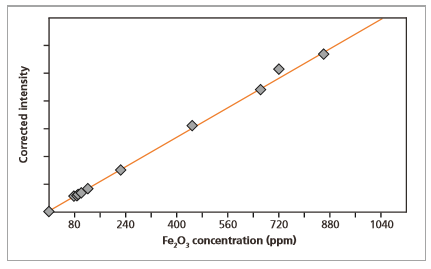
Figure 2. Calibration graph for Fe2O3 in soda glass
| Compounds | Concentration range | Correlation
| RMS* |
|---|---|---|---|
| Al2O3 (wt%) | 0.00 – 1.78 | 0.9961 | 0.055 |
| CaO (wt%) | 0.00 – 9.23 | 0.9999 | 0.012 |
| Cl (ppm) | 0.0 – 920 | 0.9339 | 9.5 |
| Cr2O3 (ppm) | 0.0 – 5.2 | 0.8332 | 0.8 |
| Fe2O3 (ppm) | 0.0 – 859 | 0.9998 | 5.9 |
| K2O (wt%) | 0.0 – 0.393 | 0.9988 | 0.002 |
| MgO (wt%) | 0.00 – 4.19 | 0.9908 | 0.178 |
| MnO2 (ppm) | 0.0 – 25.7 | 0.9756 | 1.2 |
| Na2O (wt%) | 0.00 – 14.30 | 0.9918 | 0.596 |
| SO3 (ppm) | 0.0 – 290 | 0.9989 | 32.4 |
| SiO2 (wt%) | 71.50 – 100 | 0.9999 | 0.127 |
| SnO2 (ppm) | 0.0 – 739 | 0.9886 | 45.5 |
| SrO (ppm) | 0.00 – 60 | 0.9705 | 2.6 |
| TiO2 (wt%) | 0.000 – 1.002 | 0.9916 | 0.0008 |
| ZrO2 (ppm) | 0.0 – 330 | 0.9876 | 3.5 |
To test the instrument precision, a glass microscope slide was measured 20 times consecutively using the measurement time of the calibration. The average concentrations and standard deviations for all compounds are shown in the first two columns in Table 3. The data reflects the high precision of the instrument.
The instrument precision was also tested with shorter measuring times of 15 minutes and even 200 seconds. Even with shorter measuring times, the data in Table 3 show good precision results. Therefore, depending on the precision required, the optimal measuring time can be selected.
| Compounds | Average conc. | Std. dev. 25 min | Std. dev. 15 min
| Std. dev. 200 s |
|---|---|---|---|---|
| Al2O3 (wt%) | 1.644 | 0.015 | 0.048 | 0.080 |
| CaO (wt%) | 7.169 | 0.010 | 0.010 | 0.020 |
| Cl (ppm) | 55.9 | 0.8 | 0.7 | 1.0 |
| Cr2O3 (ppm) | 1.2 | 0.1 | 0.2 | 0.3 |
| Fe2O3 (ppm) | 77.1 | 0.3 | 0.5 | 0.8 |
| K2O (wt%) | 0.350 | 0.002 | 0.003 | 0.006 |
| MgO (wt%) | 3.636 | 0.042 | 0.119 | 0.170 |
| MnO2 (ppm) | 29.8 | 0.4 | 0.4 | 5.9 |
| Na2O (wt%) | 14.770 | 0.347 | 0.333 | 1.040 |
| SO3 (ppm) | 267 | 1.9 | 3.5 | 8.0 |
| SiO2 (wt%) | 72.911 | 0.194 | 0.330 | 0.720 |
| SnO2 (ppm) | 0.0 | 0.2 | 0.4 | 0.7 |
| SrO (ppm) | 3.9 | 0.08 | 0.11 | 0.20 |
| TiO2 (wt%) | 0.102 | 0.0008 | 0.0009 | 0.0020 |
| ZrO2 (ppm) | 24.2 | 0.1 | 0.2 | 0.6 |
The results display the capabilities of the Epsilon 1 for the analysis of major, minor and trace compounds in soda glass. Precision in XRF can be managed through the selection of measuring time. These data demonstrate the typical precision that can be obtained on this instrument with a selection of different measuring times.