
Additive Manufacturing (AM) is a term used to describe advanced production methods whereby materials are selectively connected layer by layer to produce a part based on a 3D model. It is ideal for rapid prototyping and can be used to produce much more complex parts when compared to traditional subtractive methods, while typically producing less waste. This study looks at polymer powders used in Powder Bed Fusion (PBF) processes such as Laser Sintering (LS).
With increasing interest in using these processes for end-use manufacture, there is a need to both expand the range of materials available, and to better understand the ways in which materials behave within the processes themselves. This Application Note looks at how particle size and shape distributions measured on the Morphologi 4 provide insight into the density and flow data obtained from standard powder tests for three different polymers used in PBF additive manufacturing.
Additive Manufacturing (AM) is a term used to describe advanced production methods whereby materials are selectively connected layer by layer to produce a part based on a 3D model. It is ideal for rapid prototyping and can be used to produce much more complex parts when compared to traditional subtractive methods, while typically producing less waste.
Powder Bed Fusion (PBF) processes such as Laser Sintering (LS) were among the first AM processes to be commercialized.[1] A variety of materials can be used in PBF processes, including certain metal and ceramic powders, with this study focusing on polymer feedstocks. As illustrated in Figure 1 PBF processes involve the controlled application of a thin layer of powder, followed by the use of a thermal source such as a laser to selectively fuse the powder particles together. This is repeated for each layer and the finished part is then extracted from the powder cake. Depending on the polymer, the unused powder can often then be recycled for the next part, usually by blending it with a certain amount of virgin powder.
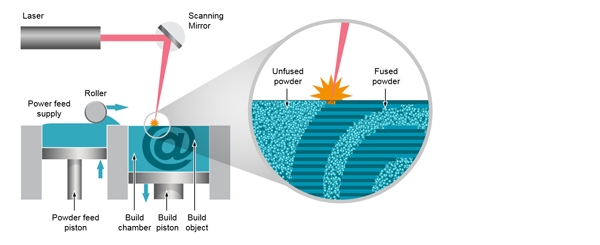
Figure 1. Diagram showing a typical Powder Bed Fusion (PBF) process.
The most common polymeric material used in PBF processes is polyamide 12 (known commonly as nylon 12 or PA 12), although a number of other polymers – such as co-polyester elastomers, polypropylene, polystyrene and other polyamides – are commercially available. With increasing interest in using these processes for end-use manufacture, there is a need to both expand the range of materials available, and to better understand the ways in which materials behave within the processes themselves.
A key reason for the somewhat limited pallet of materials is that both the intrinsic and extrinsic properties of the materials are critical to the PBF process. Many polymers do not meet those stringent requirements, particularly with regards to intrinsic properties such as thermal and rheological behavior. Nylon 12 is so widely used because it has many of these intrinsic requirements, such as a wide sintering window – the temperature between melting (during heating) and subsequent crystallization (via cooling).
Extrinsic properties such as particle size and shape are also important since these affect powder flow characteristics and packing behavior which must be optimized to give a dense, uniform powder bed. Figure 2 shows the effect particle size distribution has on packing density. It shows that packing density is maximized where the interstitial spaces between larger particles are occupied by smaller particles. However, too many fine particles can reduce free-flowing powder behavior due to increased cohesivity, which would affect the ability to form a homogenous and highly packed bed.
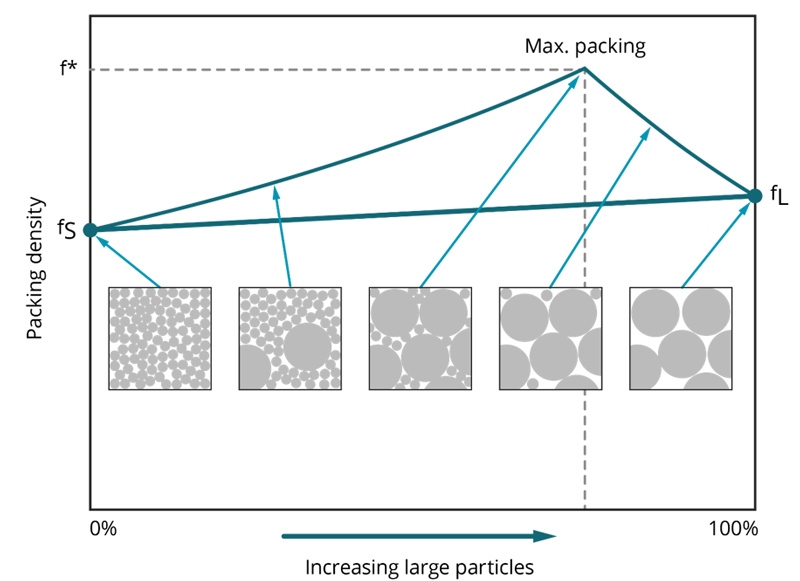
Figure 2. Illustration of the effect of particle size distribution versus packing density.
Similarly, particle shape also has an impact on both packing density and flowability of powders, and Figure 3 illustrates how irregular particle shapes and interparticle friction due to surface irregularities can reduce these properties.
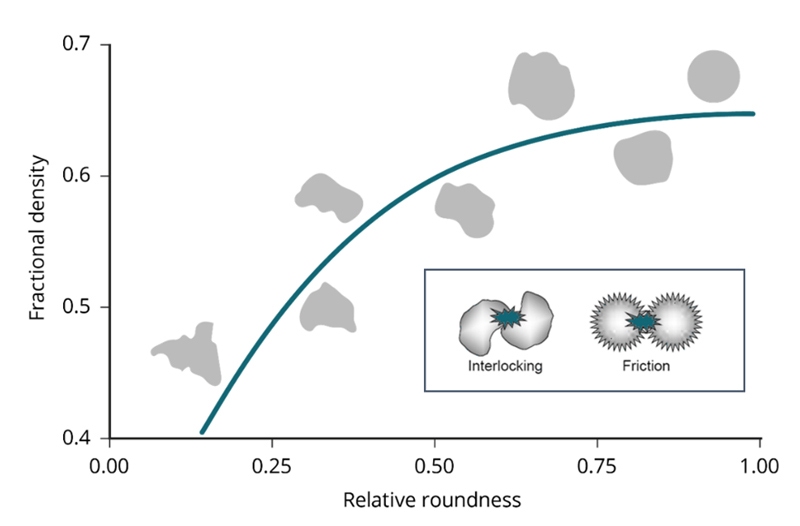
Figure 3. Illustration of the relationship between fractional density (true density/tap density) versus particle shape, and frictional forces caused by surface irregularities.
The Malvern Panalytical Morphologi 4 system (Figure 4) is an automated static image analysis system that provides statistically relevant particle size and particle shape information, enabling a greater understanding of both sample and process. Through the automated imaging of tens to hundreds of thousands of particles, the Morphologi 4 delivers both qualitative and quantitative analysis of a powder sample. This is advantageous when considering other popular imaging techniques such as Scanning Electron Microscopy (SEM), where typically only a low number of images are analyzed.
![[i_170628_224_mg4_row12.jpg] i_170628_224_mg4_row12.jpg](https://dam.malvernpanalytical.com/3fcf9aa7-d042-4974-a115-b09000ce0358/i_170628_224_mg4_row12_Original%20file.jpg)
Figure 4. The Morphologi 4 system
This Application Note looks at how particle size and shape distributions measured on the Morphologi 4 provide insight into the density and flow data obtained from standard powder tests for three different polymers used in PBF additive manufacturing.
Three fresh polymer powders used in PBF additive manufacturing processes were selected for automated image analysis on the Morphologi 4 system:
The average angle of repose, freely-settled bulk density and tapped density were also measured for each polymer powder.[2] These measurements were selected as reasonable indicators of powder deposition within a PBF system, whereby the angle of repose has relevance to powder being deposited via a chute or hopper, and the density measurements provide an indicator of comparative powder bed packing densities.
The integrated Sample Dispersion Unit (SDU) was used to disperse the polymer powders onto a glass plate. For each sample, 5 mm3 of powder was dispersed at 2 bar air pressure. Figure 5 shows field of view images of the dispersions for the three powders.
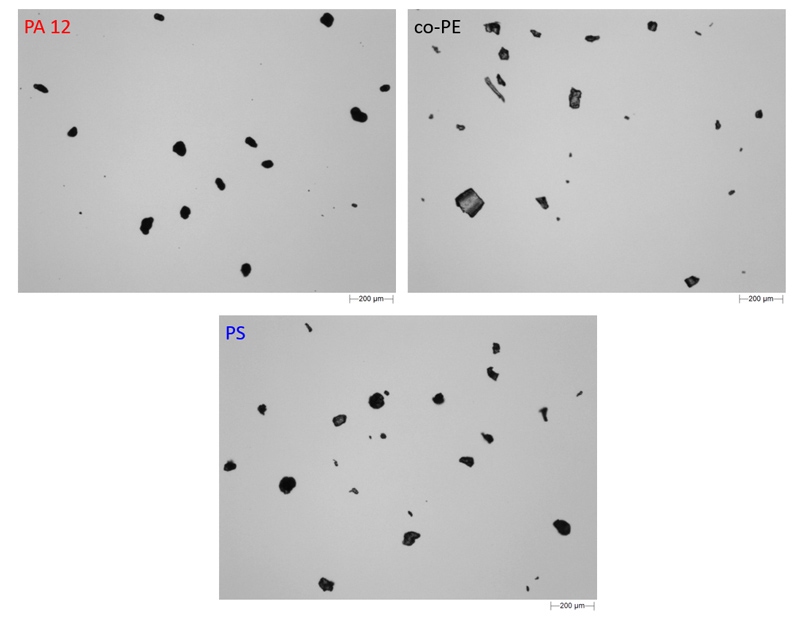
Figure 5. Field of view images of the dispersed PA 12, co-PE and PS polymer powders at 5x magnification.
The polymer samples were measured according to a Standard Operating Procedure (SOP) on the Malvern Panalytical Morphologi 4 system, which specified the analysis of a specific area of the dispersion using the Sharp Edge image segmentation method with diascopic illumination and the 5x magnification objective. A solidity < 0.8 filter and a convexity < 0.85 filter were applied to omit touching particles from the analysis. For each analysis >10,000 particles were imaged in approximately 30 minutes.
The three polymer samples were dispersed and measured in duplicate (data not shown) using the same dispersion conditions and SOP to confirm reproducibility. The two records were then combined in the Morphologi 4 software (further improving the statistical relevance) to give one record per sample.
Table 1 summarises powder flow and bulk density data based on some of the standard test methods used to assess bulk powder properties. The angle of repose is the steepest angle relative to the horizontal plane that a material can be piled without slumping and is a good indicator of interparticle friction. The freely settled and tapped bulk density were measured to investigate the packing density characteristics of the samples. Hausner Ratio (HR) is the ratio of tapped to bulk density and is an indicator of powder flowability, with low values indicating better flow.
| Powder | Average Angle of Repose (°) | Material Density (g/cm3) | Freely-Settled Bulk Density (g/cm3) | Tapped Bulk Density (g/cm3) | Hausner Ratio |
|---|---|---|---|---|---|
| PA 12 | 25.2 | 0.93 | 0.46 | 0.53 | 1.14 |
| co-PE | 28.2 | 0.99 | 0.48 | 0.56 | 1.17 |
| PS | 28.2 | 0.86 | 0.36 | 0.49 | 1.38 |
| Table 1: Freely settled/tapped bulk density and powder flow characteristics for the three polymer powders | |||||
Based on these results, it can be concluded that the PA12 and co-PE powders would be likely to achieve a more well-packed powder bed. The PS powder would be likely to produce a less dense bed, though it is worth noting that these properties may have been intentionally chosen if the PS powder is being used to produce casting patterns that are designed to be burned out. By measuring the particle size and shape distributions for the three polymer powders, the Morphologi 4 provides complementary, quantitative data that show the importance particle morphology has on powder bed formation.
The Morphologi 4 provides particle size information both as a number weighted Circle Equivalent Diameter (CED) distribution and, by transforming the data, a volume-weighted CED distribution. The latter enables the results to be compared more easily to those from ensemble-based particle sizing techniques such as laser diffraction.
Overlaying the volume-weighted CED distributions (see Figure 6) shows that all three powders have particle sizes in the expected processable range for commercial laser sintering systems.[3] While the nylon 12 (PA 12) and polystyrene (PS) powders have a median particle size around 70 µm, the co-polyester (co-PE) powder is slightly larger at around 80 µm, with a Dv(90) of 119 µm versus 90 µm for the other two powders. This means that the minimum layer thickness that can be formed with the PA 12 and PS powders would be smaller than with the co-PE powder, which is also an important consideration when choosing a feedstock material.
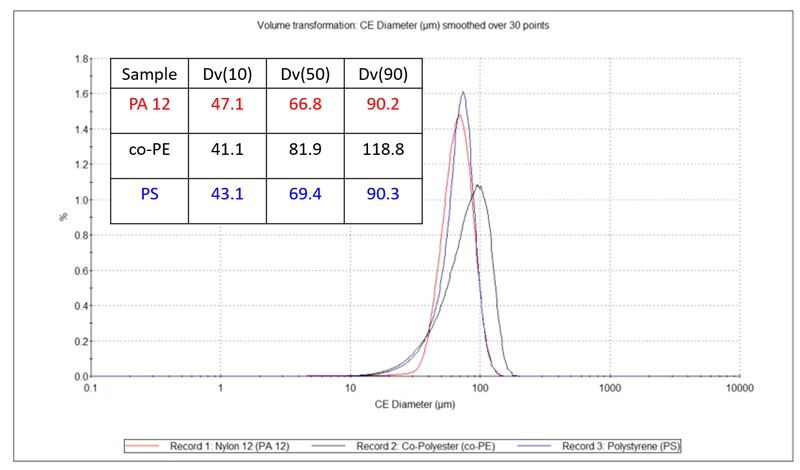
Figure 6. Volume weighted circle equivalent diameter (CED) distributions of the PA 12 (red), co-PE (black) and PS (blue) powders. The 10th, 50th and 90th percentiles are also shown.
The number weighted CED distribution (where each particle is counted equally) enables the fine particle fraction to be compared easily between the three samples. The overlay of the number weighted CED distributions in Figure 7 reveals that the PA 12 powder is bimodal, containing a much larger fraction of sub-10 µm particles compared to the PS and co-PE powders, which are more polydisperse. The inclusion of this fraction of fine particles in the PA 12 powder may be designed to increase the powder bed packing density[3] and is also likely to include additives designed to aid flow.
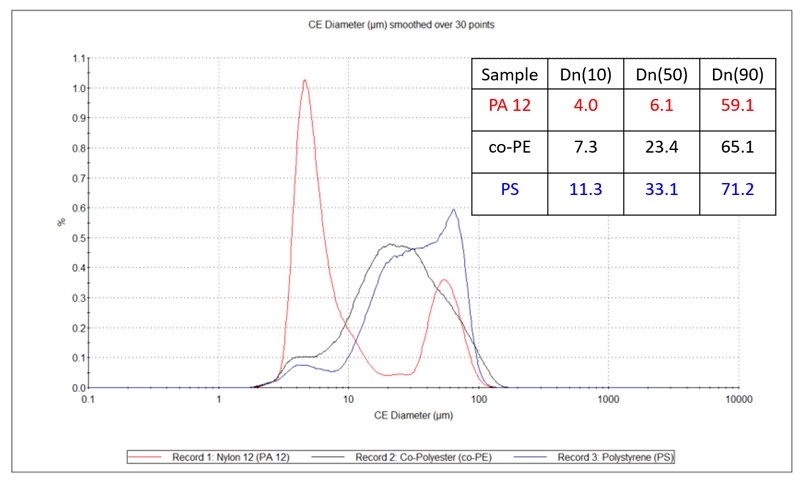
Figure 7. Number weighted circle equivalent diameter (CED) distributions of the PA 12 (red), co-PE (black) and PS (blue) powders. The 10th, 50th and 90th percentiles are also shown.
To investigate particle shape, a filter was applied to each measurement to omit particles with a CED smaller than 10 µm. This allows the larger particle size fraction in each sample to be compared, without the large number of fines in the PA 12 sample skewing the analysis.
Overlaying the cumulative undersize High Sensitivity (HS) circularity distributions (Figure 8) quantifies that the co-PE and PS powders are irregularly shaped, which also becomes evident to the user when the recorded particle images from the three powders are compared. In comparison the PA 12 particles are more rounded, with a potato shape that is typical for precipitated commercial nylon 12 powders.[3]
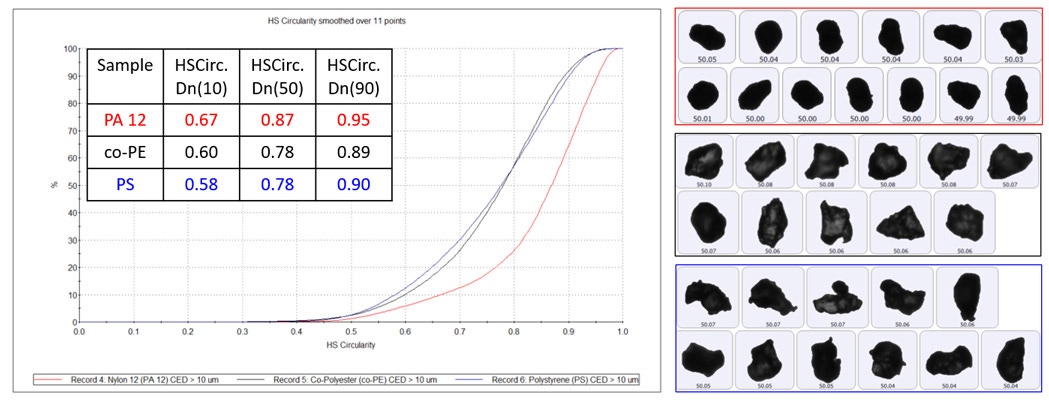
Figure 8. HS circularity distributions of the PA 12 (red), co-PE (black) and PS (blue) powders (CED ≥ 10 µm). The 10th, 50th and 90th percentiles are provided, as well as example images of particles with a CED around 50 µm from each sample.
The elongation (1 - aspect ratio) and convexity (a measure of particle edge roughness) distributions for the three powders are given in Figure 9. These further show the greater sphericity of the PA 12 particles relative to the more irregular co-PE and PS particles, helping to explain why the PS and co-PE powders have the highest angle of repose (see Table 1). This suggests that particle shape, creating interparticle friction, is more important than size for this metric.
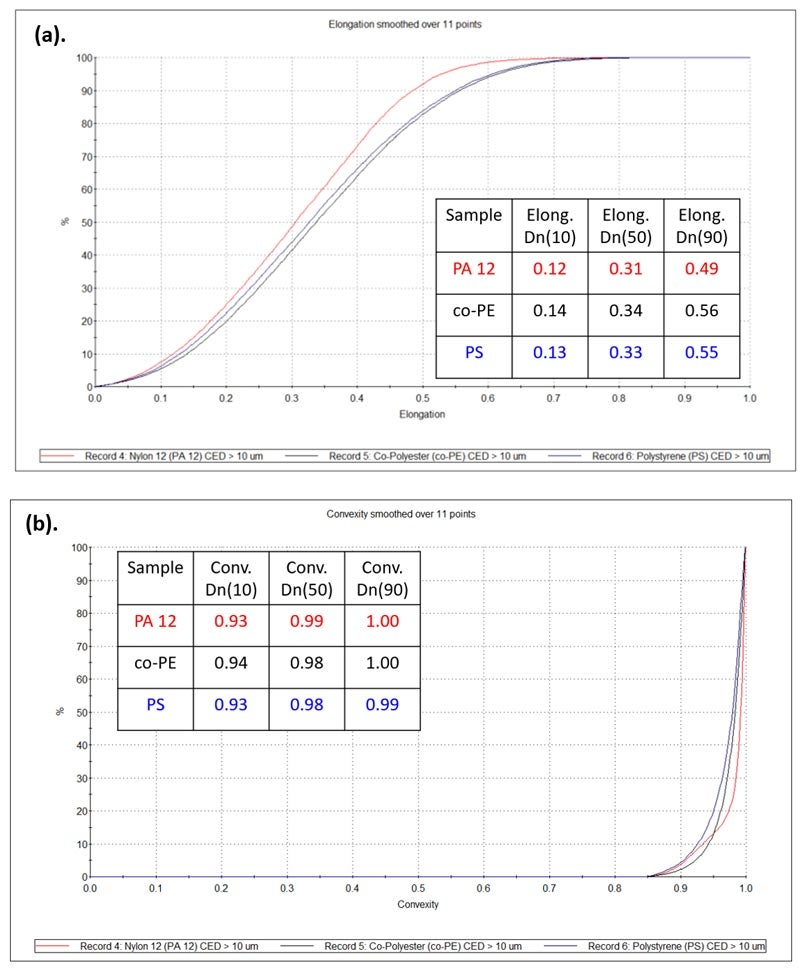
Figure 9(a). Elongation and (b). convexity distributions of the PA 12 (red), co-PE (black) and PS (blue) powders (CED ≥ 10 µm). The 10th, 50th and 90th percentiles are also shown.
In terms of bulk density and tapped density, the PS powder has the lowest value indicating less efficient packing. Since PS has a similar Dv(50) to the PA 12 powder but more irregular particles this suggests that particle shape is the biggest factor here. The co-PE powder has a similar bulk and tapped density to the PA 12 but has more irregular particles; however, this is primarily due to the higher material density (0.99 g/cm3) of co-PE.
Despite the co-PE and PS powders both having irregular particles, the co-PE has a lower Hausner Ratio (HR), suggesting better flowability. This is likely due to the larger particle size (less cohesion), as well as the higher material density. Although the PA 12 and PS powders have similar volume weighted particle size distributions, the former are more spherical which is the primary reason for the lower HR.
In PBF additive manufacturing processes the quality of the powder bed is a controlling factor for manufacturing efficiency and final part quality. This study found that a single Morphologi 4 measurement provides statistically relevant particle size and shape information that is complementary to the data derived by four standard tests of polymer powder packing density and flowability. Access to this analysis can give manufacturers and users quick and valuable insight into how to optimize their feedstock and process parameters. The Morphologi 4 can also be used to study polymer recycling in PBF processes, which we cover in another Application Note.[4]