
Understanding the effects of processing a polymer on its molecular weight, molecular weight distribution, and solution viscosity are important to manufacturers. Knowing whether a recycled or reground polymer will still fall within specifications can save time and money. Knowing what the polymer characteristics are at end use can help avoid failures and improve specifications.
This Application Note describes the Gel Permeation Chromatography (GPC), or equivalently Size Exclusion Chromatography (SEC), analysis of the degradation of poly(lactic acid) (PLA) in both of these described scenarios, but the general methods and analysis can be applied to any polymer system where degradation could be an issue.
Two different sets of PLA samples were analyzed for this Application Note. The first set looks at the effect of regrinding the polymer after an initial use for recycling. This analysis will help a polymer manufacturer know if and how many times they can recycle their product while remaining within the set specifications. The polymers will be referred to as Virgin and Regrind.
The second set looks at the effect of 3D printing on a PLA feedstock and the final printed product. This analysis is looking to understand the stability of the feedstock to the printing process. With this information, a user can adjust the incoming feedstock to either minimize degradation (with additives or stabilizers) or account for the expected degradation. These polymers will be referred to as 1-Pre, 1-Post, 2-Pre, and 2-Post, where “1” and “2” refer to the different PLA formulations and “Pre” and “Post” refer to the polymers before and after printing.
A Malvern OMNISEC RESOLVE and REVEAL triple detection GPC system was used to analyze the two different sets of polymers (Figure 1). The system is comprised of a refractive index (RI) detector to measure the concentration at each elution time, a viscometer detector to measure the intrinsic viscosity (IV) of the sample, and a light scattering detector to directly measure the molecular weight (MW).
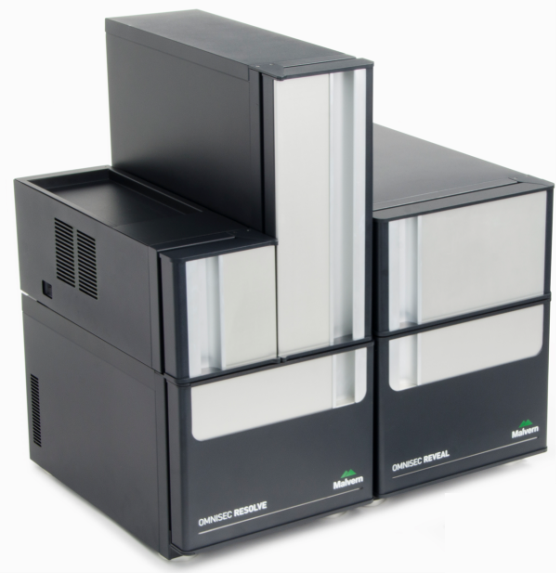
Figure 1. Malvern’s OMNISEC Triple Detection GPC/SEC System.
Figures 2 and 3 show the triple detector chromatograms for samples Virgin and Regrind, respectively. In these chromatograms, the RI detector signal is shown in red, the viscometer signal is shown in blue, and the right angle light scattering (RALS) signal is shown in green. The calculated MW at each slice of the chromatogram is shown with the gold curve.
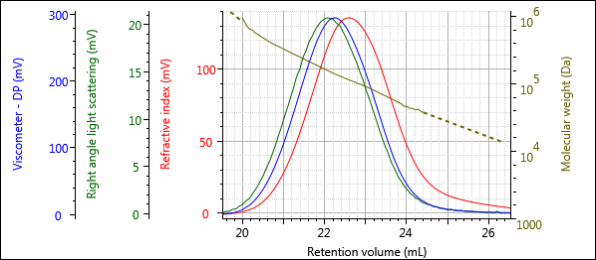
Figure 2. Triple detector chromatogram of the Virgin sample.
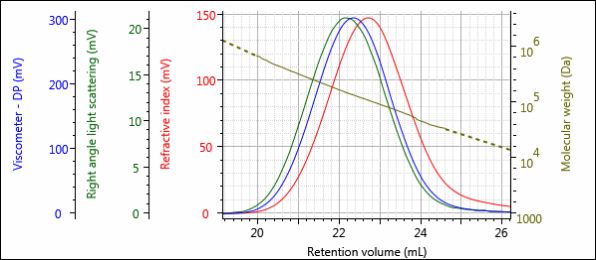
Figure 3. Triple detector chromatogram of the Regrind sample.
At first glance, these two injections appear nearly identical. A helpful way to better compare these two samples would be to overlay them on the same plot (Figure 4).
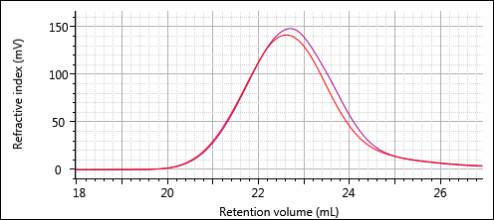
Figure 4. Overlay of the RI chromatograms for the Virgin (red) and Regrind (purple) samples.
There is a slight difference from inspection of Figure 4. The Regrind sample appears to have more material on the tailing end of the peak which corresponds to lower MW polymer. By taking the quantitative results from the software and comparing those, we can determine exactly how much difference there is between the two samples. These results are summarized in Table 1 below. The data shown is an average of three injections of each sample. Presented values include the moments of the MW distribution (Mn, Mw, and Mz), dispersity (Mw/Mn), IV, and hydrodynamic radius (Rh).
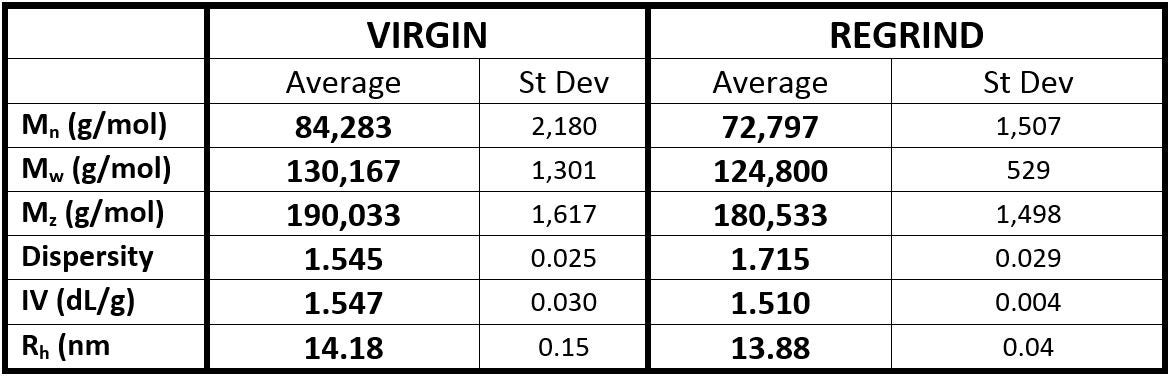
Table 1. Calculated results for PLA samples before and after regrinding.
This data shows the samples are degrading in that the MW is dropping along with the IV and Rh. While the differences are small, they are statistically different, and this might be the difference between a product being within a given specification or not.
Figures 5 – 8 show the triple detector chromatograms of samples 1-Pre, 1-Post, 2-Pre, and 2-Post. As with Figures 2 and 3, the RI detector signal is shown in red, the viscometer signal is shown in blue, the RALS signal is shown in green, and the calculated MW at each slice of the chromatogram is shown with the gold curve.
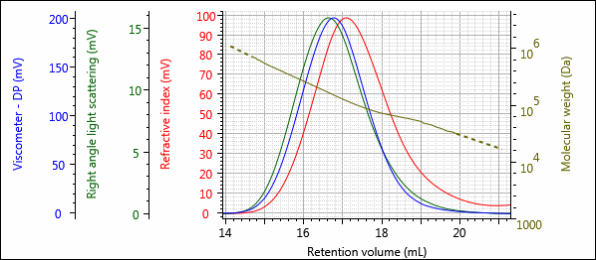
Figure 5. Triple detector chromatogram of sample 1-Pre.
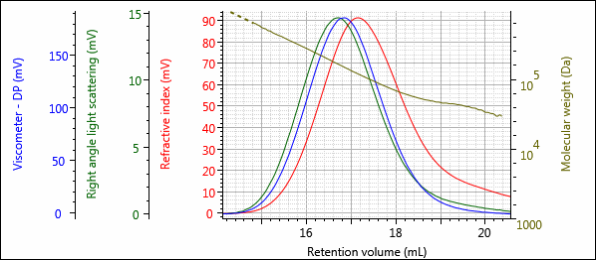
Figure 6. Triple detector chromatogram of sample 1-Post.
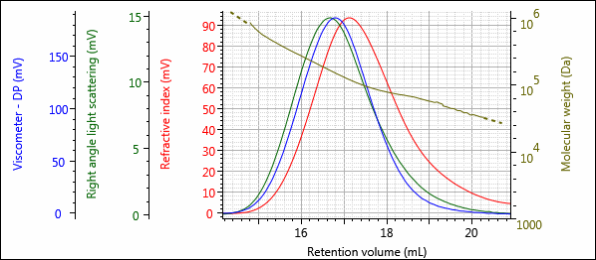
Figure 7. Triple detector chromatogram of sample 2-Pre.
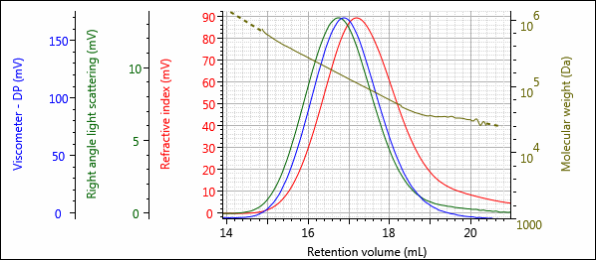
Figure 8. Triple detector chromatogram of sample 2-Post.
Figures 9 and 10 show the overlays of the RI chromatograms for the two different formulations. For both figures, the polymer before printing is in red and after printing is in purple.
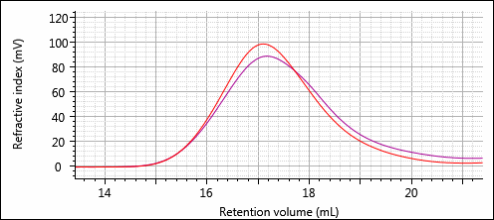
Figure 9. Overlay of RI chromatograms for samples 1-Pre (red) and 1-Post (purple).
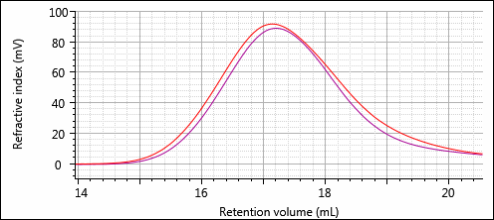
Figure 10. Overlay of the RI chromatograms for samples 2-Pre (red) and 2-Post (purple).
There are distinct differences between the peak shapes for formulation 1 (Figure 9). There is more polymer on the front end of the peak before printing and more material on the back end of the peak after printing. From this we can infer a decrease in MW due to printing. While there are differences between the two chromatograms for formulation 2 (Figure 10), these are more differences in peak intensity rather than peak shape. This peak intensity difference is most likely from a difference in concentration between the two sample solutions prepared for analysis. As before, a more detailed and accurate comparison can be done using the quantitative results which are shown in Table 2.
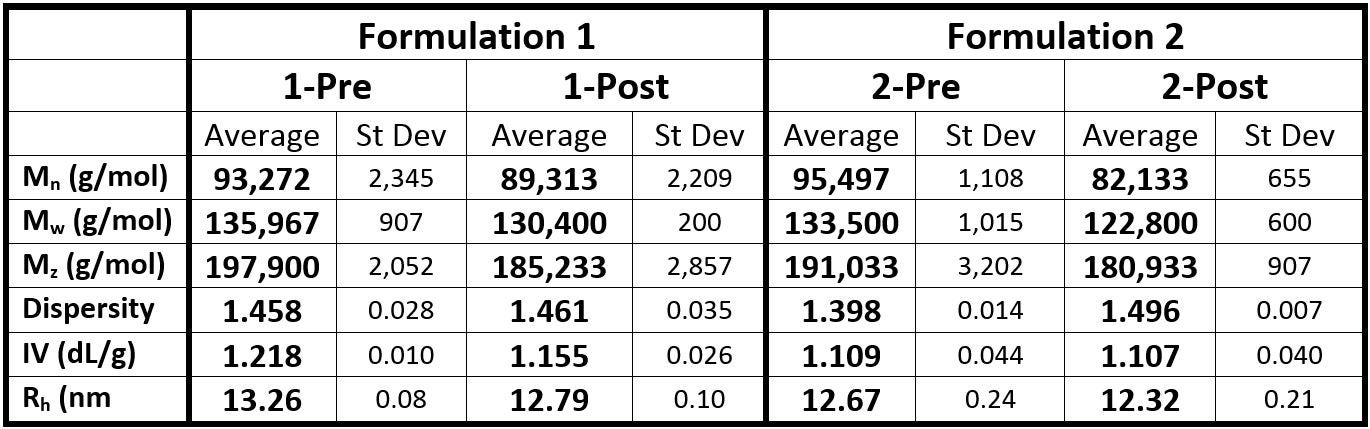
Table 2. Calculated results for the two PLA formulations before and after 3D printing.
Both formulations show a decrease in MW, IV, and Rh after printing. Despite the peak shapes being fairly similar, formulation 2 shows a more pronounced decrease in MW both relatively and in absolute magnitude. This type of information can be valuable to manufacturers looking for a polymer to better withstand the printing process.
GPC/SEC provides an effective method of determining polymer degradation. By analyzing the sample before and after processing, a user can determine changes in MW, IV, and Rh. These metrics and changes in these metrics are vitally important to manufacturers looking to recycle some unused polymer into the feedstock or looking into problems with a final, processed product. This maximizes profit margins by minimizing wasted product and limiting the need for recalls and/or manufacturing downtime to address problems.