
The calculators are a series of tools in the Zetasizer software that allow the user to make the most of the available data by calculating a number of extra parameters such as protein charge and the DLS interaction parameter, kD. Although not all are exclusively for proteins, most of the calculations are designed with proteins in mind.
This technical note describes these calculators, shown below, and gives a brief explanation of the theory behind them.
|
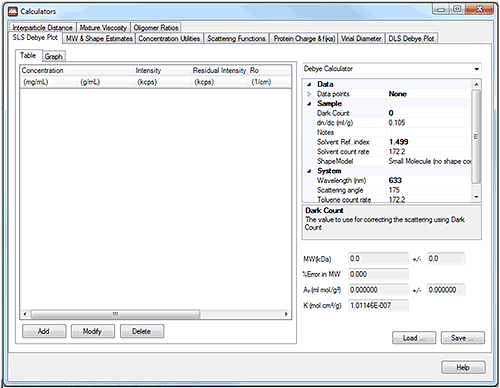
The SLS Debye plot uses the Zimm equation to create a Debye plot and, from it, calculate molecular weight and the second virial coefficient, A2.
The Zimm equation is:
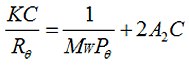
|
Where, K is a constant dependent on the sample dn/dc, C is the sample concentration, Rθ is the Rayleigh ratio (the ratio of scattered light intensity to incident light intensity), Mw is the weight average molecular weight and A2 is the second virial coefficient. Pθ is an angular dependent term (by default, assumed to be 1 for small molecules <15nm radius). The software will estimate a value of Pθ if a shape model is selected based on a simple relationship between Rh and Rg. If this is used, a sample radius must be input into the calculator.
A Debye plot is a plot of KC/Rθ as a function of concentration. If Pθ is assumed to be 1, the slope of this line is 2A2 and the intercept is 1/Mw.
The user inputs a series of values of measured light scattering intensity at different sample concentrations and the graph is plotted. Other parameters such as the sample dn/dc etc. are input in the table on the right hand side. By selecting 'chart properties' from the drop-down menu in the top right hand corner of the tool, the graph can be customized.
For information on why A2 is a useful value to measure, see the application note MRK1845, "Using A2 and kD to assess protein interactions in formulations".
The shape estimates calculate the Perrin factor and prolate and oblate axial ratios of a molecule based on the molecular weight, specific volume and measured hydrodynamic radius. The Perrin factor is a measure of how the particle deviates from being spherical in shape. The prolate axial ratio is the length divided by the thickness of an ovoid shape whereas the oblate axial ratio is the width divided by the thickness of a disc shaped object.
The user enters the values in the box on the left and the results are displayed on the right. If desired, a solvent layer can be subtracted from the hydrodynamic size value. It is possible for the user to define this value. The default is 2.5 nm.
The molecular weight estimate tool calculates an estimated molecular weight for a particle based on an input hydrodynamic size. The results are calculated for four models which are globular proteins, linear polysaccharides, dendrimers and branched polysaccharides.
The hydrodynamic size estimate tool calculates an estimated hydrodynamic size based on an input molecular weight. The same four models are used as in the molecular weight estimate.
For more information on these factors, consult the Malvern FAQ "Can you get shape information from DLS?"
Reference on Perrin Factor: Cantor, C.; Schimmel, P (1980) "Biophysical Chemistry Part II: Techniques for the Study of Biological Structure and Function", Pub: W.H. Freeman and Co, New York
Reference on globular protein molecular weight estimate: Nobbmann, U. "Characterization down to Nanometers: Light Scattering from Proteins and Micelles", Chapter 4 in "Mesoscale Phenomena in Fluid Systems" edited by Case, F. H. and Alexandridis, P., ACS Books & Oxford University Press, (2003), pp.22-59
The concentration and scattering calculator uses a series of input values such as size, sample volume and concentration to calculate a number of other values. This includes the number of particles in the scattering volume and the estimated light scattering count rate for a real measurement of the sample.
The minimum concentration calculator estimates the minimum concentration of a protein required to perform a particular measurement on a particular instrument type. The user enters the protein molecular weight and the boxes will be populated with an estimated minimum concentration required to successfully perform the measurement.
The scattering function tool uses different light scattering theories, including Mie theory, to plot particle scattering as a function of laser wavelength, angle, solvent refractive index and particle properties.
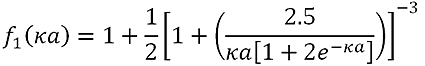
The protein charge and f(κa) calculator tool calculates f(κa) for the Henry equation using the Ohshima equation for monovalent salts. Measured electrophoretic mobility, hydrodynamic radius, ionic strength, solution viscosity and temperature are input by the user in the box on the left and the calculated values for f(κa) are displayed in the f(κa) results box.
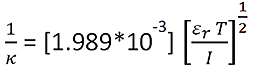
The Debye length (the thickness of the electrical double-layer), 1/κ, is calculated using the equation:
|
Where, εr is the solution dielectric constant, T is the temperature, and I is the solution ionic strength.
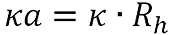
κa is calculated using the equation:
|
Where Rh is the hydrodynamic radius.
f(κa) is calculated using the equation:
|
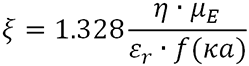
Zeta potential (ζ) is calculated using the equation:
|
Where η is the solution viscosity and µE is the measured protein electrophoretic mobility.
Finally, protein valence (Z) is then calculated using the equation:
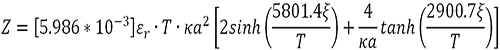
|
Reference: Loeb, A.L, Wiersema, P.H. and Overbeek, (1961) "The Electrical Double Layer around a Spherical Colloid Particle" MIT Press, Cambridge Mass
Reference: H. Ohshima. J. Colloid Interface Sci. 168, 269 (1994)
The virial diameter calculator tool calculates an apparent size, also known as the "thermodynamic diameter", based on molecular weight and the 2nd virial coefficient.
It is based on the equation:
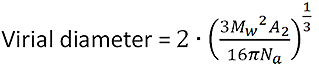
|
where Mw is the weight average molecular weight, A2 is the second virial coefficient, and Na is Avogadro's number.
Reference: Smith et. al. Analyst, 2007, 132, 455-460
The DLS Debye plot allows the user to manually create a 'dynamic Debye plot' of measured diffusion coefficient as a function of sample concentration. The graph is based on the following relationship:
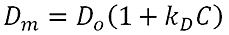
|
Where Dm is the measured diffusion coefficient, D0 is the diffusion coefficient at a sample concentration of zero, C is the sample concentration and kD is the DLS interaction parameter. In a dynamic Debye plot, Dm is plotted as a function of C. The intercept of this graph is D0 and the slope of the line is kD*D0. kD can therefore be calculated from the slope of this line.
As protein concentration increases, the individual molecules will interact with each other affecting their diffusion speed and subsequently the measured hydrodynamic radius. kD is therefore a measure of this interaction. kD has two components, a thermodynamic (kT) and a hydrodynamic component (kH). The value itself is defined as:
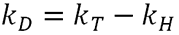
|
Where:
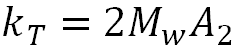
|
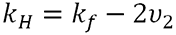
|
The thermodynamic component is therefore related to the weight average molecular weight and the second virial coefficient. The hydrodynamic component is related to kf, the first-order concentration coefficient in the virial expansion of the frictional coefficient and ν2 is the partial specific volume of the protein.
D0 and kD can therefore both be calculated from the dynamic Debye plot. When size is varying by concentration, the hydrodynamic size calculated from D0 can be considered the 'true' hydrodynamic radius. kD is, then, a measure of the interactions between the protein molecules and is related to A2.
The user inputs a series of values of measured diffusion coefficients at different sample concentrations and the graph is plotted. Other parameters such as the viscosity etc. are input in the table on the right hand side. By selecting 'chart properties' from the drop-down menu in the top right hand corner of the tool, the graph can be customized.
For more information on the usefulness of kD see the application note MRK1845 "Using A2 and kD to assess protein interactions in formulations".
Reference: Yadav et. al. J Pharm Sci, 2012, 101, 998-1011
Reference: Teraoka, I. (2002) "Polymer Solutions: An introduction to Physical Properties", Wiley & Sons, Inc.
The interparticle distance calculator can be used to compare the physical distance between the molecules in a sample and the size of the electrical double layer on the molecules.
Concentration, protein valence (charge), ionic strength, protein molecular weight and temperature are input in the box on the left and the results are calculated on the right.
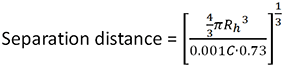
The separation distance between the molecules is calculated using the equation:
|
Where C is the sample concentration, Rh is the protein hydrodynamic radius and 0.73 is a commonly used estimate of protein partial specific volume.
The Debye length, 1/κ is calculated as in the 'protein charge and f(κa)" calculator.
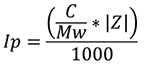
The protein contribution to I, Ip, is calculated using the equation:
|
Where Mw is the protein molecular weight and Z is the protein valence.
The intended use of this calculator is to assess the difference between the Debye length and the separation distance between the particles. The conclusion that can be drawn is that if the Debye length is longer than the separation distance, then the molecules' electrostatic fields will be overlapping and therefore interacting.
The mixture viscosity calculator is a tool that calculates mean viscosity based on the volume fraction and individual viscosities of component solvents.
It should be noted that some combinations of solvents do not have a predictable viscosity so this tool can only be used as an estimate.
The oligomer ratio calculator is a tool that estimates the level of protein monomer and dimer in a single intensity peak. The known sizes of the monomer and dimer are input along with the intensity-weighted modal peak size. The calculator estimates the proportions of monomer and dimer, which could account for the measured size.
Reference: Nobbmann et al.Biotechnology and Genetic Engineering Reviews, 2007, 24, 117-128