Two years ago Vulcan Materials Company upgraded its cement finishing circuit by installing an Advanced Process Control (APC) solution from Pavilion Technologies, a Rockwell Automation company, and real-time particle size analysis from Malvern Instruments.
Together these solutions have transformed operation delivering major economic gains, particularly with respect to energy consumption, and much improved product quality.
Two years ago Vulcan Materials Company upgraded its cement finishing circuit by installing an Advanced Process Control (APC) solution from Pavilion Technologies, a Rockwell Automation company, and real-time particle size analysis from Malvern Instruments. Together these solutions have transformed operation delivering major economic gains, particularly with respect to energy consumption, and much improved product quality.
In 2006, Vulcan Materials made the decision to upgrade the finishing circuit by switching from manual to automated process monitoring and control. This white paper describes the project, examining the benefits delivered by the Cement Grinding Application solution from Pavilion Technologies and the Insitec Fineness Analyzer from Malvern Instruments.

|
Vulcan Materials Company (Birmingham, Alabama, US) is the leading producer of construction aggregates in the US. Through its acquisition of Florida Rock Industries in 2007 Vulcan added cement manufacturing to its construction materials portfolio. The cement production from the company's Newberry facility utilises modern technology in the manufacture of both Portland and masonry cement. The final stages of production involve milling clinker, gypsum and limestone to the required fineness in a ball mill circuit. The fineness of the finished cement is a key determinant of strength with 1-day strength being particularly important for the markets served.
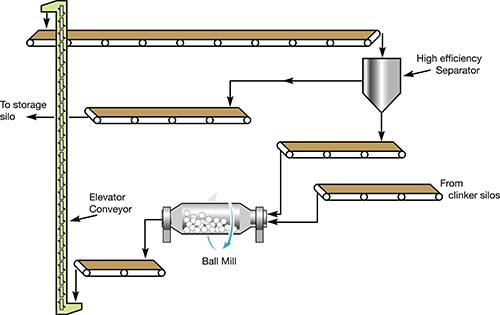
The finishing circuit grinds the clinker produced in the upstream kiln to a specified surface area, Blaine. An elevator conveyor feeds the output from the ball mill to a high efficiency separator which extracts a product cut on the basis of particle size; oversized material is recycled to the mill
(see fig 1). Prior to the installation of automated control, the performance of the circuit was maintained by manually manipulating the feed rate, separator speed and separator draft since these three parameters have a strong impact on process behaviour. Routinely-measured plant variables and regular off-line Blaine analysis provided data on which to base remedial action.
|
Blaine measurements are widely used within the cement industry to quantify particle fineness. The analysis is based on determining the pressure drop across a packed bed and can only be executed off-line. At Vulcan Materials, sampling and associated measurement is carried out every two hours to check product quality. The data can be used for process control but clearly do not provide real-time insight into the process.
Recognizing the limitations of a manual approach, the operations team decided to invest in an automated control solution to optimize operation, focusing on energy consumption and product quality. Vulcan Materials selected a control package from Pavilion Technologies specifically designed for optimizing cement finishing circuits.
At the heart of the Pavilion Cement Grinding Application solution is a multivariate process model that predicts performance from a range of inputs. Automatic manipulation of controlled variables on the basis of these predictions keeps the plant within a defined operating window targeted to optimization goals. The objective is to:
The specific details of the Vulcan Materials circuit were captured by developing a control scheme uniquely tailored to the plant which was configured via process testing. The configuration procedure defines the mathematical relationship between different parameters for the individual unit, producing an accurate model for dynamic and continuous optimization. When the plant is operational the model runs in real time, driving the system towards an optimal operating point within the defined constraints.
A feedback loop measures process response and compares actual response to desired values. A steady state optimizer calculates the correct changes to manipulated variables in order to drive controlled variables to target. An integrated dynamic controller then projects these into the future, developing a series of control actions for each manipulated variable and predicting the effect on the controlled variables in order to meet multiple targets simultaneously. The purpose is to minimize a certain objective function such that the predicted process outputs are as close as possible to the desired reference trajectories.
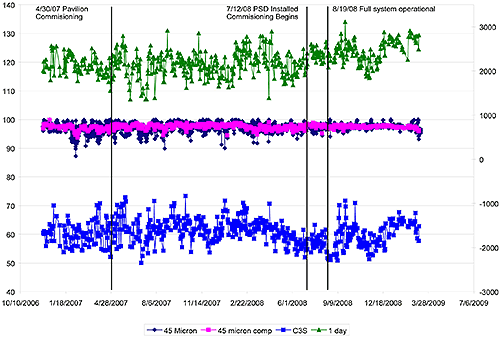
This optimization procedure is repeated as process values are re-read and the effect of the first control action has been observed, so that the future prediction horizon period is maintained. This is termed "real-time receding horizon control", a characteristic of model predictive control. To summarize, the system is an integrated controller-optimizer, capable of calculating and driving the process to the optimal position, as it changes, in real time, in this case every 30 seconds. Table 1 shows the controlled variables for the circuit as they were initially set up (prior to the installation of on-line particle size analysis).
| Description | Control type |
|---|---|
| Blaine | Desired target |
| Elevator kW | Upper constraint |
| Mill outlet material temperature | Upper / Lower constraint |
| Mill condition | Desired target |
| Mill kW | |
| Return flow |
The Pavilion8 controller manipulates both clinker feed rate to the mill and separator speed to control product Blaine. Elevator power, a measure of the feed rate to the separator, is pushed towards a user-defined high limit using the same parameters and by varying mill vent fan damper, which controls air flow through the mill. This latter variable, along with the mill exit water spray, influences the temperature of the material leaving the mill, maintaining it at the required set point. A final loop stabilizes the system by minimizing 'mill condition', a variable calculated from the rate of change of elevator and mill power. If mill condition deviates from zero, air flow through the mill and exit water spray rate change to bring it back.
|
An important feature of the software platform is the Soft Sensor that predicts Blaine from the input variables. Comparing predicted values with measured lab data allows the solution to correct for differences. This refinement process is facilitated by the ability of the system to properly account for disturbance variables: issues affecting the process that are not directly controllable. For example, any changes in the grindability or temperature of the clinker entering the ball mill will impact the plant, triggering process changes. There will be a control response to this change to keep the process on track in terms of control variables, with the underlying robustness of the model correcting for such disturbances even when these are not specifically included in the controller.
The implementation of automatic control both stabilized and improved the performance of the plant, allowing it to run more successfully, for longer periods and with less manual input, with controller utilization in excess of 95%. However, inaccuracies arising from manual Blaine variability and operator error cannot equal the accuracy of real-time PSD measurement. Furthermore, results from an in-house lab study showed that 1-day strength correlated much more closely with certain particle size parameters than it did with Blaine. Moving away from Blaine to on-line particle size measurement seemed the next logical step.
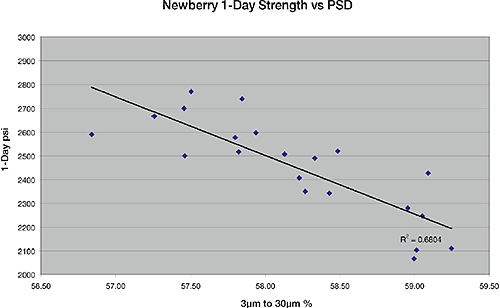
Figure 3 shows a correlation, produced by QC personnel at the site, between 1-day strength and the amount of material between 3 and 30 microns. Particle size data were generated using a Mastersizer 2000 from Malvern Instruments, an off-line laser diffraction analyzer.
|
The study uncovered close correlations between particle size parameters and early strength. One of the limitations of Blaine is that it provides a single number representation of a sample rather than the distribution supplied by particle size measurement. Two cement samples each with a different particle size distribution can give the same Blaine, yet perform differently in the field, because of the relative proportions of fines or over-sized material. The results quantified the link between early strength and key particle size parameters, giving a better basis for process control.
Investigating the correlations between particle size and cement performance gave additional insight for improving product quality. Particle size directly impacts strength by controlling the rate of cement hydration because it affects specific surface area, but this study shows that particle size also influences water demand. During use, cement is mixed with water and other admixtures to form a slurry with a certain consistency; 'slump' is the term used to define mobility. Here the researchers found that controlling certain particle size parameters reduces the amount of water required to form a mixture with 'normal slump'. This is an important finding because less water in the mix results in higher early strength.
In summary, the off-line study suggested that controlling on the basis of particle size rather than Blaine would give tighter control of product performance and stabilize/reduce water demand, compounding the benefits to the customer.
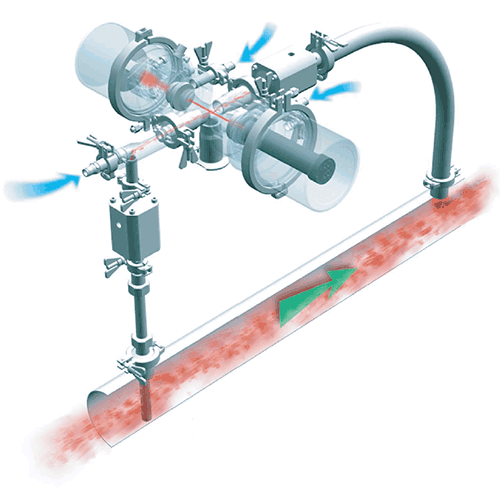
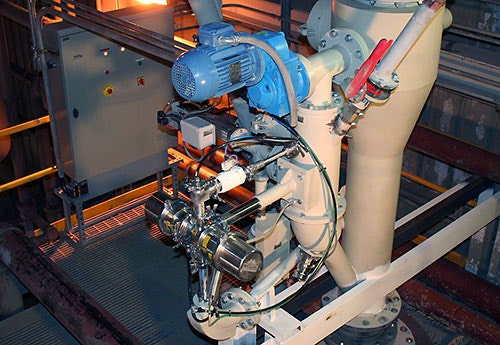
Building on the information generated in the off-line study, Vulcan Materials installed an on-line Insitec Fineness Analyzer, a laser diffraction system that generates real-time particle size data. Prior application of the analyzer in other cement plants had met with success in the process environment. Installation of the Insitec was quick and unproblematic, and its commissioning straightforward. It is now an integral part of the plant, running reliably 24/7. Availability of the system since installation has been in excess of 95%.
A representative portion of the process stream flows continuously through the sample loop returning to the line after analysis (see figure 4). Measurement itself is non-destructive and rapid, the system generating up to four complete particle size distributions every second. The analyzer software facilitates integration with the plant control platform fully automating all aspects of measurement. For routine monitoring and control the system reports:
|
Refining the control model to use these parameters, rather than Blaine measurements, was the final step in moving towards fully automated monitoring and control. In total, installation and commissioning of the analyzer and modification of the model took around five weeks with very little intrusion on plant operation. Once the complete solution was in place full optimization of the circuit became straightforward.
The combined control solution has pushed the circuit into a new operating regime, quite different from where it was before. As optimization proceeded the information gathered facilitated a key change in operation of the separator. It became obvious that higher loadings improve separation efficiency, so elevator power is now pushed to a maximum, as highlighted above. A decrease in separator speed gives the required product cut at this higher feed flow.
The most dramatic change in terms of process economics is the 20.3% reduction in specific energy i.e. the amount of energy used to mill each tonne of cement (see table 2). Mill power is now significantly lower even though throughput (feed rate) is more than 15% higher. Milling benefits are also accruing from a 15% reduction in ball charge. Analysis of the product quality data reveals why the milling process has become easier.
| Before Pavilion | After Pavilion without Insitec | Pavilion and Malvern | |
|---|---|---|---|
| Bucket elevator power (kW) | |||
| Average | 48 | 60 | 69 |
| StDev | 3.81 | 2.35 | 3.33 |
| Separator speed (rpm) | |||
| Average | 1414 | 1536 | 1476 |
| StDev | 40 | 45 | 22 |
| Total feed rate (tph) | |||
| Average | 118 | 127 | 136 |
| StDev | 4.2 | 5.7 | 3.8 |
| Mill power (kW) | |||
| Average | 4884 | 4902 | 4468 |
| StDev | 21 | 13 | 19 |
| kWh/t | 41.8 | 39.1 | 33.3 |
| Notes: Ball charge reduced 8/15/08 from 34% in both C1 and C2 to 28% in C1 and 30% in C2 this reduced the mill power. | |||
| Before Pavilion | After Pavilion | After PSD | |
|---|---|---|---|
| 45µm mill samples (%) | |||
| Average | 96.97 | 97.11 | 97.52 |
| StDev | 1.77 | 1.52 | 1.06 |
| 45µm daily components (%) | |||
| Average | 97.02 | 97.56 | 97.45 |
| StDev | 0.98 | 0.77 | 0.40 |
| One day strength (psi) | |||
| Average | 2125.49 | 2176.54 | 2454.35 |
| C3S (%) | |||
| Average | 60.22 | 61.21 | 59.69 |
One-day strengths are now 15% above baseline levels with a product Blaine 10% lower than before the control was implemented. Better understanding of the particle size parameters controlling strength, coupled with tight process control, provide that the product is milled only as much as is necessary to meet the specification.
The improvement in product quality also permits a reduction in C3S (alite) concentration (see figure 5). Increasing C3S concentration improves early strength but increases energy costs because the kiln conditions required to produce it are more demanding. As strength targets are now more easily reached, Vulcan Materials has decreased C3S level, reducing the operating costs of the kiln.
|
The water demand of the product is now stable and relatively low, and positive feedback has been received from end users. While product quality benefits are hard to quantify in financial terms, energy savings are easier to estimate.
The company calculates that the capital investment associated with both systems has already been fully recouped, in energy savings alone, giving a payback period of just over one year for the entire project.
Vulcan Materials Company has successfully transformed operation of the cement finishing circuit by automating control and installing real-time particle size analysis. The company now produces better quality cement at lower cost period. The success of the project is attributable to three key factors:
With fully automated, optimal process control the plant runs very differently from the way it did before the project was instigated. Throughput is higher, feed to the separator has increased, and mill power consumption is lower; over-milling is now negligible. One-day strength is around 15% higher, even though the plant is now running to a much lower Blaine than before. Water demand is stable and low, and user feedback positive.
|