With QbD now embedded in the psyche of the pharmaceutical industry its application is extending beyond the product development pathway. Analytical instrumentation and methods are increasingly the focus of attention. Here Paul Davies and Paul Kippax from Malvern Instruments look at the application of a risk based approach to analytical instrument design, development and manufacture and the reassurance it offers to pharmaceutical users.
The last decade has seen a shift within the pharmaceutical industry towards a design space approach to development and manufacture, an agenda underpinned by ICHQ8, Q9 and Q10 and the concept of Quality by Design (QbD). However, because a design space approach naturally focuses attention on the areas of a project that are potentially the most vulnerable to failure it has broader value for risk management.
Within the pharmaceutical industry, those most confident and comfortable with QbD are beginning to extend its application beyond the product development path to, for example, the deployment of analytical equipment and associated method development, validation and transfer. The roots of the integrity of analytical data lie in the approach taken to the design and manufacture of the analytical instrument. Analytical instrument companies that align themselves with a QbD philosophy can therefore offer pharmaceutical customers the reassurance of closely similar working practices and products that meet the exacting standards of the industry.
In this article Paul Davies and Paul Kippax from Malvern Instruments examine how a QbD approach can inform analytical instrumentation design and manufacture, focusing on the benefits for those who go on to use the equipment. Examples from the development of the Mastersizer 3000 particle size analyzer demonstrate the practicalities.
A systematic approach to development that begins with predefined objectives and emphasizes product and process understanding and process control, based on sound science and quality risk management- International Conference of Harmonization document Q8(R2) (ICHQ8).
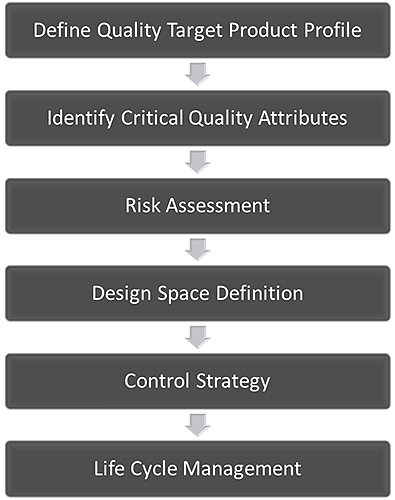
The central idea of QbD is that quality should be built into a product from the outset. It is an approach based on the development of a thorough understanding of the variables that impact performance, quantification of the risks associated with those impacts, and knowledge-based risk mitigation. Figure 1 shows an accepted QbD workflow for the development of a pharmaceutical product. The first step is to define how the product must behave to deliver the required clinical efficacy. This definition is called the Quality Target Product Profile (QTPP). Subsequent steps involve identifying the variables that must be controlled to deliver that defined product performance, and the best way of implementing the necessary control.
|
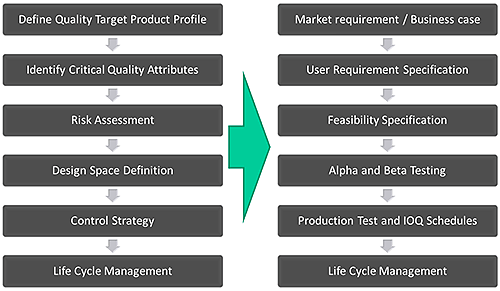
This approach of first defining exactly what performance is required, and then systematically developing the knowledge and control strategies to deliver this, is highly pertinent to the process of developing new analytical instrumentation. A rigorous approach to development, with an emphasis on product and process understanding, sound science and quality risk management, can be usefully applied in instrument design. Figure 2 shows a simplified version of the product design process that Malvern Instruments uses for instrument development, across all of its products and how it maps onto the established QbD workflow.
The target or QTPP for the QbD workflow is derived from a Market Requirement Specification (MRS) which summarizes the features that are currently desired by the customer population. Within pharmaceutical development this may be an improved pharmacological feature, such as a tightly controlled delayed drug release profile, and will be most often based on clinical requirements. For the analogous instrument design workflow the MRS may pertain to a wider measurement range or a smaller instrument footprint; features that can be identified from customer feedback and/or in-house brainstorming by a development team with extensive application expertise. The resulting list of development targets satisfies the QTPP definition of “a summary of customer requirements that must be delivered to market the product”.
|
The next steps of the Malvern design process involve reviewing the feasibility of building a product to meet the critical requirements identified from the MRS: the user requirement specification (URS). This involves generating ideas as to how to meet the URS and identifying the critical features of the instrument that will confer the desired level of performance. These are the ‘Critical to Quality Attributes’ (CQAs) of the system. Once selected, these are considered as part of the feasibility specification for product, where the design required to meet the URS is selected. As part of this, methods such as Failure Mode Effects Analysis (FMEA); Design for Six Sigma (DSS); Design for Manufacture (DFM) and Design for Assembly (DFA) are applied. These reflect the need to look at the design of the instrument from the perspective of consistent production, as well as delivered performance.
An important milestone within the feasibility assessment is construction of the first ‘x-model’, to prove the design concept. The x-model is designed to work like the finished product. It enables realistic exploration of the technology and its performance, but may look quite different from the final design. An iterative process follows, during which several x-model versions may be built as the design space is established. This consists of a range of acceptability for each CQA.
Once all of the CQAs are fully understood, the final x-model has been built and assessed, and the design space for the instrument is approved, several alpha models are manufactured. This is the point at which the development process begins to focus on how the instrument will be manufactured, in significant quantity, to meet the defined QTTP. In other words, what control strategies will be necessary to ensure a robust supply of instruments of the required quality? A supply chain is established to provide components for the alpha models which are built to deliver the QTPP and to both work and look very much like the product as it is intended to be marketed. The performance of the alpha models is tested with standard reference samples with well-defined characteristics as well as customer samples which are relevant to the target market. Checks are also made to ensure that all relevant regulatory requirements are fully met.
The second stage of developing a control strategy involves building a larger population of beta units, typically many tens of units. This provides more instruments for testing, enables a wider assessment of the manufacturing process and refinement of the supply chain. At this stage any standard operating procedures (SOPs) associated with manufacture of the instrument are finalized and full IQ/OQ documentation is delivered. Referring back to pharmaceutical product QbD, this part of the development cycle can be seen as analogous to scaling up the process, the move from producing a small quantity within the lab to kilogram quantities on a pilot plant process line.
A critical element of this second control stage is that the instruments are now tested with real samples. Malvern distributes a number of beta units to selected customers so that a diverse range of ‘real-world’ samples can be measured using them. This provides assurance that the instrument will be operable as envisaged by potential users and robustly deliver acceptable data for different types of samples. Success at this stage is marked by sign off of a design review, following which the instrument passes into commercial manufacture.
The process described above, from publication of the final MRS to full product launch, can take several years depending on the complexity of the product and related peripherals. However QbD calls for an ongoing process of continuous improvement and so this simply marks the end of one critical stage in a cycle that will wrap around the lifetime of the instrument.
Although all of Malvern’s products are developed using the approach outlined above, the Mastersizer 3000 laser diffraction particle sizing system has a particularly interesting development story that exemplifies the value of a QbD approach to instrument design.
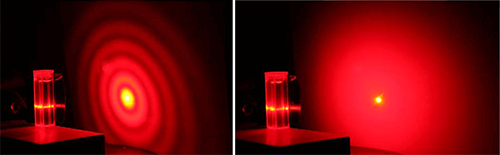
The Mastersizer 3000, which was launched in 2011, was developed as a direct replacement for the Mastersizer 2000, which over more than a decade of production had become the most widely used particle sizing system in the world. Laser diffraction is a method of determining particle size distribution from measurements of the angular intensity of scattered light produced by a dispersed sample. When a sample is illuminated by a collimated laser beam the larger particles within it scatter light with high intensity at small angles while smaller particles scatter light more weakly at wider angles (see Figure 3). Particle size data can be calculated from a detected light scattering pattern, using the Mie theory of light, which correlates scattering behavior with particle size.
|
Important considerations when it comes to developing a laser diffraction particle size analyzer are to:
At its launch the Mastersizer 2000 delivered major advances on all three of these criteria, but in the subsequent decade several areas for improvement gradually emerged. From industry analysis and customer feedback two clear market requirements were identified:
These features became the two key QTPPs that dictated the design of the Mastersizer 3000.
|
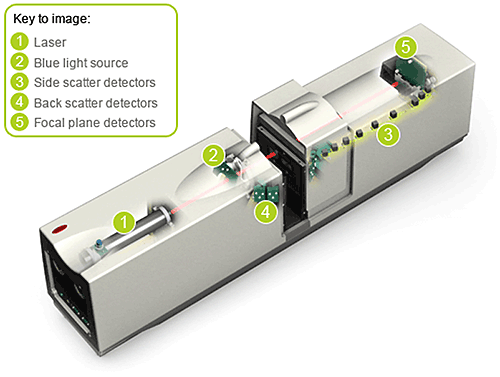
The Mastersizer 2000 has a measurement range of 20 nm to 2 mm. It uses two discrete light sources to deliver this performance (see Figure 4), a laser that provides red (longer wavelength) light and an additional blue (shorter wavelength) light source. The detector array used to measure the scattered light pattern produced by a sample consists of multiple detectors contained within a 1.4 meter long optical bench. The length of a laser diffraction system is defined by the upper size limit of detection and increasing the upper measurement range to 3 mm with the existing Mastersizer 2000 technology would have resulted in a 30 – 40 cm increase in optical bench length. Clearly this worked against the QTPP of smaller instrument footprint.
As the design was assessed with reference to the QTPP a number of CQAs emerged for the envisaged Mastersizer 3000. Firstly, smaller components were needed to improve the practicalities of making a smaller instrument. However, smaller components potentially increase the likelihood of alignment problems, between the laser and detector. The successful use of smaller components would therefore require optical alignment standards to be set to tighter tolerances than in the Mastersizer 2000.
To meet the particle size range, multiple lasers were required, as in the preceding instrument, but any moving components within the system would have to be robust to ensure a seamless transition between the light sources for access to different areas of the measurement range. Finally, sample handling requirements would need to be augmented to ensure the robust measurement of larger particles in the upper particle size distribution range.
In summary the CQAs that emerged to meet the QTPPs coming from the MRS were:
Increasing the upper limit of detection of a laser diffraction instrument relies on measuring at smaller scattering angles, potentially extending the length of the optical bench. Decreasing the detector size was therefore especially important in the development of the Mastersizer 3000. Doing so delivers an overall decrease in instrument size and a simultaneous increase in measurement range, helping to satisfy both QTPPs. Figure 5 contrasts the size of the focal plan detector, the main element of the detector array, for the Mastersizer 2000 with that of the newer instrument, clearly demonstrating the size reduction that Malvern were able to achieve using state of the art optics.
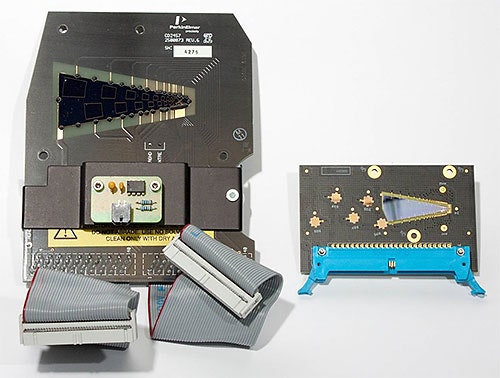
|
However, measuring at very small angles to the incident beam, as is necessary for larger particles, with a small detector increases the potential impact of poor alignment. FMEA analysis in this area initiated the development of a new measurement cell locking design to minimize this risk. The developed device was created and tested 17,000 times to ensure an optimal design that would deliver the necessary repeatability and robustness.
To meet the CQA concerning multiple laser sources a red laser and a blue LED light source were incorporated into the design. The red laser is nominally used to measure particles above ca. 500 nm whereas the blue light source is required to provide the resolution necessary for particles smaller than this. A theoretical optical design was constructed using computer aided design (CAD) to determine the optimal position of the two light sources relative to the light scattering detectors.
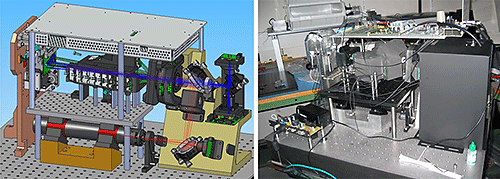
|
A complication arising from the inclusion of two light sources is the need to transition smoothly between them. Furthermore, the red gas laser must remain on at all times once the instrument is in use, which means it remains on while measurements using the blue light source are being taken. Developing a method of preventing red light passing through the optical system during measurement with the blue source was therefore essential. The functionality to switch between the red and blue light source during a single measurement was also necessary to ensure successful measurement across the full dynamic range. An innovative shutter design was therefore implemented to meet these requirements and simultaneously satisfy the need for more robust moving components.
With new components in place to meet the challenges associated with the QTPPs, the first models of the Mastersizer 3000 were built.
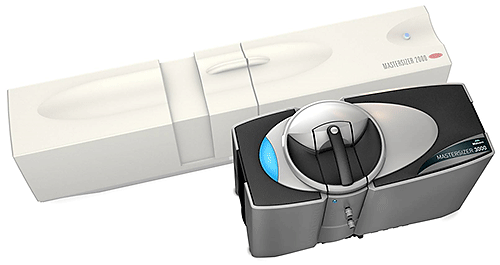
|
The innovations relating to each critical element of the instrument produced a Mastersizer 3000, with an increased detection range of 10 nm - 3.5 mm and a 690 mm optical bench: an instrument footprint half that of the Mastersizer 2000, delivering a wider measurement range. Careful selection and refinement of each of component within the optical bench has satisfied all of the CQAs associated with its performance. However, ensuring that the QTPP for robust measurement across a wider dynamic range was fully satisfied required a look beyond the internal mechanics of the instrument to the influence of sample handling – the final CQA.
Most samples undergoing laser diffraction particle sizing require some form of dispersion, to present particles within the measurement zone in a state that is relevant and/or representative of the bulk powder. The options are either dry dispersion, where the sample is entrained in a stream of pressurized air, or wet dispersion, which involves suspending the sample in a suitable dispersant. Control strategies were put in place to ensure robust dispersion with either method, as part of the Mastersizer 3000 development project. A detailed examination of the accessory design for wet dispersion shows how this was achieved.
During wet dispersion a stirrer suspends particles within the sample tank, to maintain a stable suspension. Samples from this suspension are then drawn down into a pump chamber and then pushed towards the measurement cell of the instrument by a centrifugal pump. An ultrasound probe positioned below the pump allows sonication of the sample, to promote particle dispersion where required. Fully meeting the QTPP of measurement across an extended size range focused attention on this sample introduction mechanism, particularly the stirrer, and how it could be designed to ensure a uniform suspension and representative sample even for polydisperse samples.
An FMEA analysis of the dispersion system highlights that a poor stirring mechanism will result in biased samples passing through to the measurement cell and unrepresentative data. To test designs and mitigate this risk experiments were carried out using a bimodal sample, typically glass beads, as the test material. Controlling the bi-modality of glass beads is easy, since numerous reference samples exist and they are relatively easy to disperse, focusing attention on the efficiency of stirring.
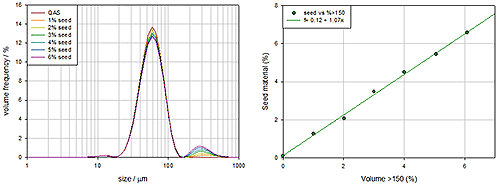
|
Figure 8 shows measurements of a series of samples where the concentration of the larger seed particles is being steadily increased. These demonstrate that the stirring mechanism is performing well since the increase in larger particle concentration produces a corresponding and linear increase in the coarse particle concentration detected. The stirrer is producing bias free data.
With all the CQAs understood and controlled, the project moved fully into alpha and beta production making more instruments and optical benches available for testing. This made it possible to rigorously test the ability of the complete system (optical bench and dispersion units) to consistently deliver reproducible particle size distribution measurements, to acceptable USP limits, across the full dynamic range. Production testing was carried out using a polydisperse glass bead standard, the properties of which comply with ISO and USP guidance for the verifying the performance of laser diffraction systems.
|
| Accessory | Dv10µm | Dv50µm | Dv90µm | |||
|---|---|---|---|---|---|---|
| Average | %RSD | Average | %RSD | Average | %RSD | |
| Aero S | 38.23 | 0.41 | 62.64 | 0.30 | 89.49 | 0.39 |
| Hydro EV | 36.08 | 0.35 | 60.82 | 0.15 | 88.74 | 0.52 |
| Hydro MV | 36.67 | 0.37 | 61.28 | 0.29 | 89.33 | 0.63 |
| Hydro LV | 36.83 | 0.57 | 61.95 | 0.38 | 89.62 | 0.44 |
| All Wet | 36.53 | 0.99 | 61.35 | 0.81 | 89.23 | 0.67 |
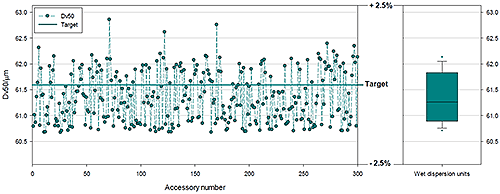
Figure 9 and Table 1 show data from three hundred different Mastersizer 3000 systems, split into groups of one hundred; each group was used with a different wet dispersion system. The Mastersizer 3000 has three different wet dispersion accessories: for large volume sampling, the Hydro LV; medium volume sampling, the Hydro MV; and a flexible dip in system for use with standard lab glassware, the Hydro EV. The data shown are for polydisperse samples with a median particle size of 61.3 microns. The results indicate excellent agreement between all dispersion systems and an RSD that confirms high precision and accuracy between optical benches. Tests such as these verify that all the necessary control is in place for all CQAs and underpin a high degree of confidence in the instrument and manufacturing process associated with it.
A defining premise of QbD is that investing effort to understand a product and learning how to efficiently control its manufacture during the earlier stages of development will yield long term dividends. Taking a risk assessment-based QbD approach to instrument design builds consistency and required performance in to a product from the outset. This thought and knowledge translates directly into an instrument that is not only reliable and compliant with regulatory requirements but that is also efficient, productive and enjoyable to use.
Furthermore the principle of continuous improvement which underpins the QbD process ensures that products developed with this mindset continue to adapt to changing market needs. For example, a new version of the Mastersizer 3000 software has recently been released that includes an optical property optimizer, a tool that directly supports method development. Software advances such as theses continue the process of meeting evolving customer requirements for secure and productive analysis. By aligning themselves with the QbD strategies that are rapidly becoming the norm within the pharmaceutical industry, instrument suppliers such as Malvern Instruments become ideally positioned to understand the needs of their customers and offer analytical solutions that are closely tailored to their needs.