Cellulose, a common polysaccharide found in the cell wall of green plants, can be transformed into hydroxylpropyl cellulose (HPC) and hydroxyethyl cellulose (HEC), a popular component commonly used as a topical ophthalmic protectant and lubricant. HPC and HEC are water soluble and both are used in food as a thickener as well as in ophthalmology as artificial tears. They are used also as binder and matrix for active pharmaceutical ingredient (API) delivery.
It is important to fully characterize these polymers for biological applications to predict the processability, performance, and potential toxicity of the formulation. This application communication demonstrates the ability of size exclusion chromatography coupled with advanced detection capabilities to separate and analyze these cellulose components.
The HEC samples were acquired from proprietary eye drop solutions by diluting the samples in a 5:1 ratio, in 0.1 M NaNO3. The HPC samples were obtained from proprietary tablet formulations by extracting the water soluble components in 0.1 M NaNO3 for 3 h at room temperature. The extractables were filtered through a 0.2 µm nylon filter before analysis.
Viscotek's model TDA305 complete SEC/GPC system was used to analyze the samples. The unit is equipped with a differential refractometer, four-capillary viscometer, right angle light scattering
(RALS), and low angle light scattering detectors (LALS). Each sample was injected twice at a volume of 100 µL and eluted in 0.1 M NaNO3 at 0.7 mL/min. Separation was performed on two ViscoGEL aqueous columns while maintaining a constant temperature of 30 °C during chromatography and detection.
The first example is the analysis of HEC in eye drop formulations. It is important to know the molecular weight as well as the polydispersity and the percentage of composition of this additive when evaluating the performance of these products. Variations in composition, molecular weight, and distribution are key diagnostics for quality control. Size exclusion chromatography was used to separate out the HEC from the other components and evaluate its properties. Figure 1 shows the triple detection chromatogram from this study. The samples evaluated are labeled Sample A and Sample B. The detectors show good signal-to-noise and peak shape while the LogMW plot indicates good size separation. Table 1 provides the data obtained from the analysis. The data presented is an average of 2 injections. Good repeatability was observed between injections and it is evident that this method resolves the small differences between the two samples.

|
| HEC Sample | MZ (Da) | Mw (Da) | Mn(Da) | Mw/Mn | IV (dL/g) | RH (nm) | Conc (%) |
|---|---|---|---|---|---|---|---|
| Sample A | 1,599,000 | 1,061,500 | 586,277 | 1.81 | 12.47 | 56.9 | 0.213 |
| Sample B | 1,508,500 | 1,031,500 | 636,736 | 1.62 | 12.71 | 57.1 | 0.245 |
|
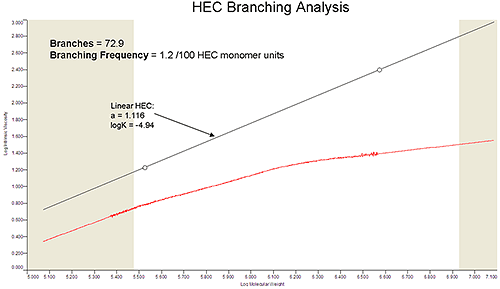
An advantage to this technique is the range of critical information obtained from a single experiment. Molecular weight and distribution were obtained along with viscosity and size data. Using these parameters, branching analysis was completed on the HEC sample (Figure 2). Using a Mark-Houwink plot (Log IV vs. Log MW), the change in viscosity across the molecular weight distribution can be observed. This change was compared to a linear HEC sample with known Mark-Houwink parameters. Knowing the degree of branching in a cellulose sample can be a valuable diagnostic during biocompatibility and quality assurance studies.
|
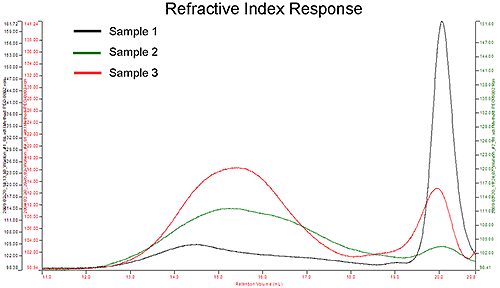
The second study evaluated the composition and properties of hydroxypropyl cellulose (HPC) used in tablet formulations. Again, small differences in composition, size, and molecular weight can be critical when predicting and evaluating the biocompatibility, drug delivery effectiveness, solubility, and toxicity of a formulation. Figure 3 shows an overlay of the refractive index response of the three samples studied. The chromatograms reveal two major peaks and it is clear that there are differences in the concentration of these two peaks between the sample sets. Another major difference is observed in the Mark-Houwink plot (Figure 4).

|
The size and density of the HPC component varies greatly across the distribution between the three samples. This variance can indicate difference in structure, drug loading efficiency, or stability of the HPC component. Table 2 provides the data from this analysis. It is clear that there are both similarities and differences between the sample sets with the most obvious differences coming in the Mw and % composition values. There are also small changes in the polydispersity and size (RH) of the HPC components. This data can be used to correlate the performance of these formulations with an accurate and precise analytical technique.
| HPC Sample | MZ (Da) | Mw (Da) | Mn(Da) | Mw/Mn | IV (dL/g) | RH (nm) | Conc (%) |
|---|---|---|---|---|---|---|---|
| Sample 1 | 230,313 | 101,788 | 57,118 | 1.78 | 2.24 | 13.9 | 7.2 |
| Sample 2 | 267,928 | 78,073 | 27,458 | 2.84 | 2.21 | 12.3 | 17.7 |
| Sample 3 | 119,752 | 78,441 | 59,007 | 1.33 | 2.58 | 14.1 | 17.8 |
Cellulose derivatives are a popular component in many pharmaceutical applications. Their bio-compatibility and viscous nature make them amenable to multiple functions such as drug conjugation and tablet binding. Analyzing the cellulose component using advanced SEC/GPC detection can assist greatly in correlating molecular weight and size properties to critical functions such as stability, drug release capabilities, and toxicity.