Abrasive slurries are used in the Chemical-Mechanical Polishing (CMP) process to smooth the surface of silicon wafers. Typical slurries contain SiO2 or Al2O3 particles in a size range from several tens of nanometers to several hundreds of nanometers. When used in the CMP process, the concentration of the slurry is around several percent by weight, however the slurries are usually prepared highly concentrated up to 40 or 50 wt% in order to decrease the cost of storage and transportation. The stability of the concentrated slurries, which is related to the zeta potential of the particle, is crucial, since it affects the stability during storage and subsequent dilution process. The zeta potential of the charged particle is determined by the dielectric constant of the solvent, the conductivity or salt content, pH and adsorption of any surface active components on the particle surface. In this note, light scattering techniques were used to investigate the zeta potential of three types of concentrated commercial slurry samples, and the influence of the slurry concentration and dilution method on the measured zeta potential.
The slurry dispersions were measured using the Zetasizer Nano ZS. The Zetasizer Nano combines both dynamic and electrophoretic light scattering techniques, which enable measurement of the particle size (hydrodynamic diameter DH), size distribution and zeta potential.
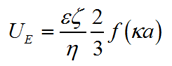
The zeta potential of the slurry particles was measured using laser Doppler electrophoresis. The measured electrophoretic mobility of the particle UE, is related to the zeta potential by the Henry Equation as:
|
Where ε is the dielectric constant, ζ is the zeta potential, η is the viscosity, f(κa) is the Henry function, a is the radius of the particle and κ is the reciprocal of the Debye length. For aqueous samples, where κa >> 1, the Smoluchowski approximation is used where f(κa) = 1.5.
The concentrated commercial slurry samples were kindly provided by Cabot Microelectronics Corporation, Taiwan. There were three types of slurry samples; samples B and C contained SiO2, and sample E contained Al2O3. The concentration of the slurry was measured by evaporating the solvent and weighing the dried powder. The details of the slurries can be found in Table 1.
| Sample Type | B | C | E |
|---|---|---|---|
| Material | SiO2 | SiO2 | Al2O3 |
| Stock Concentration (wt%) | 25.54 | 41.97 | 3.096 |
| DH (nm) | 150.6±0.8 | 78.9±0.5 | 108.1±0.7 |
| PDI | 0.10 | 0.08 | 0.08 |
| Zeta Potential of Stock Dispersion (mV) | -40.6±1.32 | -46.9±2.24 | -48.9±1.08 |
| % Laser Transmission | 1% | 1% | 1% |
The hydrodynamic diameters of the slurry particles were measured in highly diluted aqueous dispersions (2 drops of stock dispersion in 20 ml distilled water) to prevent particle- particle interactions from affecting the sizes reported.
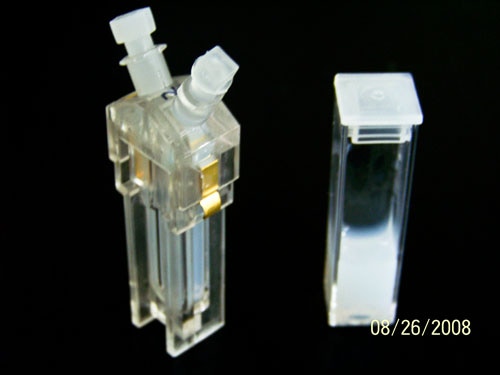
The zeta potential measurements were performed using the Malvern patented capillary cell (shown in Figure 1) which is designed with a cell thickness of several millimeters. All of the stock dispersions were measured directly without any further preparation.
|
In order to investigate the concentration effect, the particulate concentration of sample B was decreased by different means: centrifugation, adding centrifugation supernatant and addition of distilled water. Sample C was diluted by adding supernatant obtained by centrifuging the stock dispersion.
The zeta potential was successfully measured for all of the concentrated slurry samples. One of the challenges for measuring the zeta potential of concentrated dispersions is that the laser beam must pass through the sample cell. In many cases it is possible to measure without dilution since the Malvern capillary cell has a thickness of only a few millimeters which reduces the effect of absorption and scattering. The upper limit of concentration that can be measured depends on the particle size and optical properties of the particles. In the case of Sample C, the particle size is very small enabling measurements to be made at concentrations as high as 41wt%. In practice, as particle size increases the maximum concentration at which measurements may be made will be expected to fall, however for sample B it was still possible to make measurements at 25wt%.
The measured zeta potential of the stock slurry dispersions are -40.6, -46.9 and -48.9 mV for sample B, C and E, respectively. Negative zeta potential suggests that the all types of particles have a negative charge on the surface at the pH of the medium. It is seen that the absolute value of the zeta potential for all of the standard slurry samples is larger than -30 mV which suggests that they are likely to be stable to aggregation.
Dilution using centrifugation
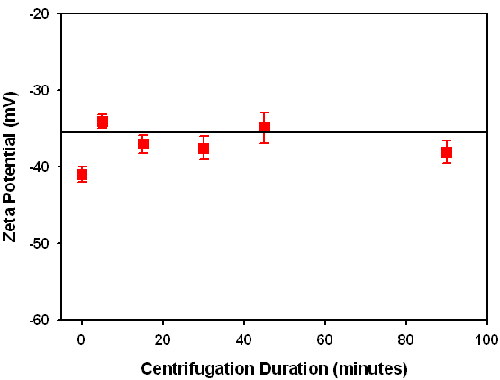
The centrifugation process causes sedimentation, which leads to a concentration reduction in the supernatant with increasing centrifugation duration. However, centrifugation is not expected to change the ionic strength and pH. The zeta potential of the supernatant remains virtually constant with centrifugation time (figure 2). This indicates that in the concentration range wt < 25%, the zeta potential has little dependence on the particle concentration for this sample.
|
Dilution using distilled water and supernatent
Sample B was also diluted by adding the supernatant obtained by centrifugation and by adding distilled water to produce a series of dispersions with different particle concentrations. The solid content in the supernatant was measured to be 0.94%.
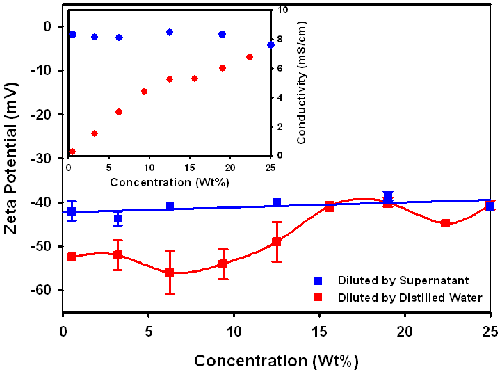
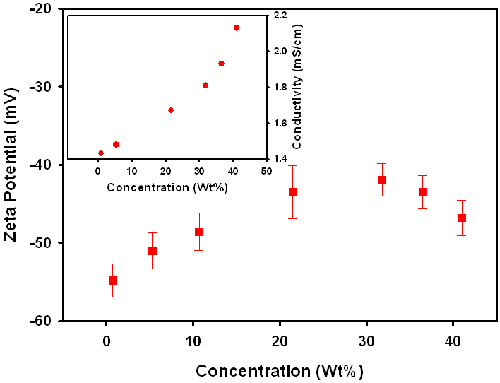
It can be seen in figure 3 that the zeta potential of the dispersion, diluted by addition of supernatant, tends to be constant in the concentration range 0.75%-25%, while the absolute value of the zeta potential of the dispersion diluted by addition of distilled water gradually increases with decreasing concentration. The reason for the difference in concentration dependence between the two dilution methods is that dilution with the supernatant maintains the same dispersion medium as in the stock dispersion, but dilution with distilled water changes the dispersion medium. This can be seen from the inset graph which shows that the conductivity is unchanged on dilution with supernatant, but falls on dilution with distilled water thereby causing a change in the chemical and physical equilibrium between particle and environment. The addition of the distilled water decreases the ionic strength, reducing the screening of the surface charge, resulting in an increase in the absolute value of the zeta potential.
|
For sample C, dilution was achieved by adding supernatant obtained by centrifuging the stock dispersion. Figure 4 shows the zeta potential of sample C as a function of particle concentration. Unexpectedly, the absolute value of the zeta potential of Sample C tends to increase with decreasing concentration below about 20wt%. The variation in the zeta potential of Sample C on addition of supernatant contrasts with the results obtained with sample B. However, one difference with sample C was that the conductivity was also found to decrease on addition of supernatant. The change in the conductivity could explain the variation in the zeta potential. However, centrifugation would not normally expect to change the concentration of the ionic components of the supernatant. After further discussion with the slurry manufacturer, it was learnt that Sample C contains a certain amount of potassium ions which exhibit preferential adsorption on the surface of the silica particles. Therefore in the case of Sample C, centrifugation causes deposition of both the colloidal particles and reduces the potassium ion concentration and consequently the conductivity.
|
In this study, the zeta potentials of concentrated CMP slurry samples were measured using the Zetasizer Nano ZS instrument. For the particular silica CMP slurries measured, it was found to be possible to make measurements without dilution at up to 41wt%. This result was achieved because of the small size of the silica particles and the narrow optical path length in the capillary cell used for the measurements.
In practice there will be cases where measurement by laser Doppler electrophoresis will not be possible without dilution. Therefore, in this study, the effect of sample concentration and the dilution method used was examined.
The concentration of the two concentrated silica slurry samples was reduced by centrifugation, addition of supernatant and addition of distilled water. From the measurement results, it can be concluded that, providing the dilution process does not change the environmental parameters such as ionic concentration and pH, the zeta potential is independent of the particle concentration. Centrifugation and dilution with the supernatant can be a useful technique in achieving this result in some cases. The conductivity of the sample is also determined during the zeta potential measurement and is found to be a useful parameter in verifying whether any significant changes in ionic concentration are occurring as a result of dilution. With lower conductivity (usually lower salt content), the screening effect on the surface charge is weaker, and the absolute value of the zeta potential is seen to increase.
We would like to thank Cabot Microelectronics Corporation, Taiwan and Dr. Ming Shih_Tsai for kindly providing the commercial slurry samples and for his help and advice in understanding the results.