Nanoparticle Tracking Analysis (NTA) can be used to study the stability of exosomes, and determine appropriate storage conditions under which aggregates are less likely to form. Here, an LM10 is used to measure the size and concentration of exosomes after storage at two different temperatures, 4°C and room temperature.
The study of extracellular vesicles is an area that has become the subject of intense study and research in recent years. These vesicles are apparently ubiquitous in a broad range of prokaryotic and eukaryotic organisms and it is believed they have a wide role to play in many physiological and pathological processes. They are typically described either as exosomes which are produced from the cell endosome or microvesicles, produced by cell membrane budding. Their cellular origin, structure, functions and characterization are still the subject of much debate. Also debated by the research community are the size of such vesicles though exosomes are agreed to be smaller in size (typically 100 nm in diameter or smaller) whilst micro vesicles are larger (typically described as being up to 1 µm in diameter).
Whilst research continues to provide insight into the role and potential clinical link of these vesicles, it is important to understand the stability of any sample under study to ensure that any differences are truly attributable to the test conditions and not to any inherent instability of the sample itself.
Here we describe the use of Nanoparticle Tracking Analysis (NTA) for size and concentration measurements of exosomes when stored at 4°C and at room temperature for up to 5 days.
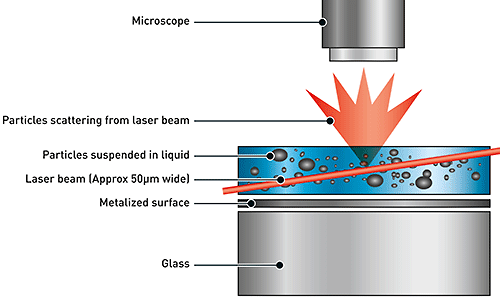
NTA utilizes the properties of both light scattering and Brownian motion in order to obtain the particle size distribution of samples in liquid suspension. A laser beam is passed through the sample chamber, and the particles in suspension in the path of this beam scatter light in such a manner that they can easily be visualized via a 20x magnification microscope onto which is mounted a camera. The camera, which operates at approximately 30 frames per second (fps), captures a video file of the particles moving under Brownian motion within the field of view of approximately 100 μm x 80 μm x 10 μm (Figure A).
|
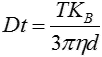
The movement of the particles is captured on a frame-by-frame basis. The proprietary NTA software simultaneously identifies and tracks the center of each of the observed particles, and determines the average distance moved by each particle in the x and y planes. This value allows the particle diffusion coefficient (Dt) to be determined from which, if the sample temperature T and solvent viscosity η are known, the sphere-equivalent hydrodynamic diameter, d, of the particles can be identified using the Stokes-Einstein equation (Equation 1).
|
where KB is Boltzmann’s constant.
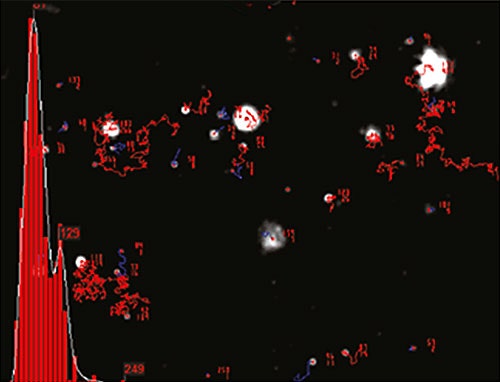
NTA is not an ensemble technique interrogating a very large number of particles, but rather each particle is sized individually, irrespective of the others. An example of the size distribution profile generated by NTA is shown in Figure B.
|
In addition, the particles’ movement is measured within a fixed field of view (approximately 100 μm by 80 μm) illuminated by a beam approximately 10 μm in depth. These figures allow a scattering volume of the sample to be estimated; by measuring the concentration of particles within this field of view and extrapolating to a larger volume it is possible to achieve a concentration estimation in terms of particles per mL for any given size class or an overall total.
Two NanoSight LM10 HSB systems were used, that were fitted with a sCMOS camera and 405 nm laser. Analysis was performed using NTA software 2.3.5.
Lyophilized exosomes from human urine and plasma were stored at 4°C until needed.
Phosphate buffered saline (PBS) (Life technologies) stored at 4°C until needed, and checked to be particle-free before use.
The urine-derived exosomes were initially resuspended in 100 µL PBS and mixed by pipetting 10 times. A further 900 µL PBS was added and the sample pipetted to mix. The exosomes were then transferred to another tube containing 19 mL PBS and gently inverted to mix. Finally, 10 mL of this sample was transferred to a clean tube and placed at 4°C (exo4_U) until needed whilst the remainder of the sample was maintained at room temperature (20-22°C) (exoRT_U) .
The plasma derived exosomes were prepared in a similar manner (exo4_P and exoRT_P).
Immediately after preparation, approximately 700 µL of the exoRT_U sample was loaded into the laser sample chamber using a 1 mL silicon oil free syringe. The sample chamber was loaded onto the instrument. The camera level was set to 16 and the image was adjusted to bring the particles into focus. Three 60 second videos were captured, advancing the sample approximately 100µL between measurements. Between samples, the sample chamber was cleaned by flushing through with approximately 5 mL PBS. Samples were measured as described above at incubation times of 0, 60, 120, 180 and 300 minutes, as well as 24 hours and 5 days.
For exo4_U samples, the camera level was set to 16 and videos captured as before at the incubation times indicated above.
Immediately after preparation, approximately 700 µL of the exoRT_P sample was loaded into the laser sample chamber using a 1 mL silicon oil free syringe. The sample chamber was loaded onto the instrument. The camera level was set to 13 and the image was adjusted to bring the particles into focus. The contrast of the image was further enhanced using the camera histogram and the threshold settings indicated in Table 1. Three 60 second videos were captured. Subsequent measurements were taken as described above at 0, 60, 120, 180, 300 minutes, 24 hours and 5 days. Exo4_P samples were measured in the same way using camera level 13.
All sample videos were analyzed off-line after all the videos had been captured. For urine-derived exosomes, all videos were analyzed using detection thresholds of 4 or 5. For plasma-derived exosomes, detection threshold 4 was used for incubation times of 60 minutes or less, detection threshold 6 for incubation times between 120 minutes and 24 hours, and detection threshold 3 for the 5 day incubation. Size distribution profiles and concentration data were collected for all samples.
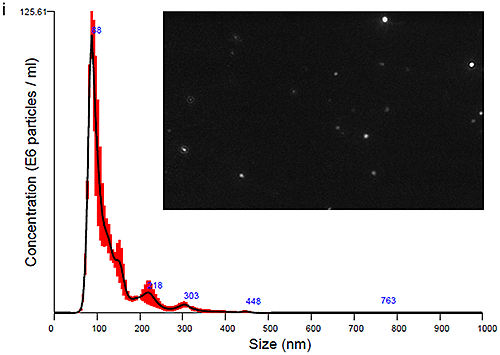
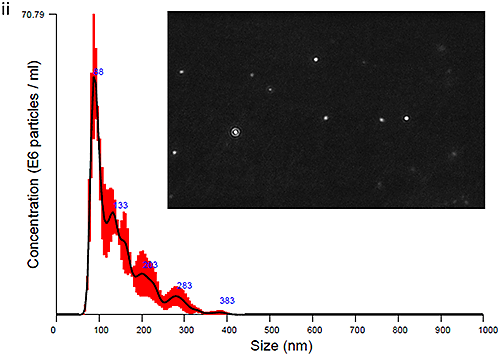
The plasma and urine-derived exosomes were measured on the NanoSight LM10 instrument to obtain size distribution profiles. Data obtained at time zero are show in Figure Ci for Plasma and Cii for Urine exosomes, with an image of the particles also shown.
|
|
The PBS-exosome suspensions were moderately polydisperse, as expected for samples that are biological in nature and processed using the described methods. The modal peaks were around 90 nm, however smaller peaks around 140 nm, 200 nm and 300 nm were also seen.
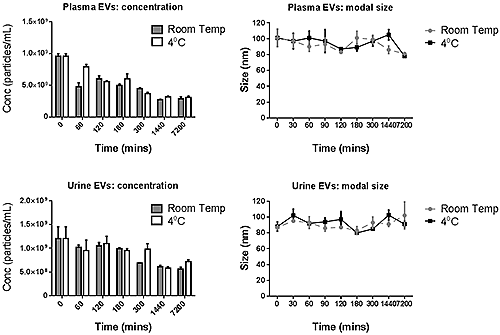
The concentration and modal size of suspensions of exosome from both urine and plasma and stored at either 4°C or at room temperature are shown in Figure D. Over the 5 day stage period there appeared to be very little variation in the size of the urine-derived exosome population at both storage temperatures, however the plasma-derived exosomes’ size appear to decrease slightly at day 5 (7200 hours). In terms of concentration both sources of exosomes showed a decrease over the measurement period. This decrease appeared to be more rapid for plasma exosomes with only 60% of the initial concentration remaining after 2 hours. After 5 days, only 30% of the starting concentration was measured. The concentration of the urinary exosomes appeared to be fairly stable for up to 3 hours, but fell to 50% of the starting concentration at 24 hours. The size distribution profiles for both samples do not show an increase in particles that are larger in size, therefore the loss in concentration is most likely due to the exosomes degrading into small fragments (under 25 nm) that are below the detectable size for the instrument.
|
NanoSight NTA measurements enabled fast evaluation of the size and concentration of exosomes to determine their stability in PBS-suspension at both room temperature and 4°C, which are common temperatures used by researches when carrying out various assays with these samples. The sample exosomes from urine appeared to have a more stable size and concentration profile compared to those from plasma, which showed an approximate 50% decrease in concentration after 2 hours when stored at either temperature. This loss in apparent integrity of the plasma exosomes tested has potential consequences for researchers, since many studies using exosomes require incubation steps within this time-frame. It also suggests that storage at 4°C provides no additional benefit to storage at room temperature. Overall, the data suggest that for these exosomes any manipulation (labelling, staining etc.) should be done as soon as possible, and that even moderate storage times can have a detrimental effect on their measurable concentration.