A series of dextran samples ranging in molecular weight from about 1– 650 kDa are characterized using OMNISEC. Structural comparisons to other polysaccharides, gum arabic and pectin are presented
Initially discovered by Louis Pasteur in 1861, dextran is a polysaccharide that has found a variety of applications, primarily in the medical field, due to its minimal side-effects and solubility in aqueous media. These applications range from eye drop lubricants to intravenous solution components for parenteral nutrition and antithrombotic agents that reduce blood viscosity and prevent blood clotting. In the context of these medicinal applications, the molecular weight of each dextran sample dictates its behavior. For example, dextran samples with molecular weights greater than 60 kDa are not easily removed from the blood, and thus exhibit blood thinning effects for a longer period of time than lower molecular weight versions. Recently, the most common dextran for anticoagulation therapy has been dextran-40, with a molecular weight of 40 kDa. Additionally, a rare but potential negative side-effect of dextran is acute renal failure, which is possibly influenced by the dextran’s intrinsic viscosity, and thus its structure. As such, the accurate analysis and molecular weight characterization of dextran samples is critical.
Gel permeation chromatography (GPC) or, equivalently, size-exclusion chromatography (SEC) is a widely used technique to characterize a wide variety of macromolecules, from bulk synthetic polymers to natural polymers and proteins. This technique can be used to measure the molecular weight moments, molecular weight distribution, intrinsic viscosity and hydrodynamic size of these macromolecules. Figure 1 shows a complete setup for a GPC/SEC system.
|
A solvated sample is carried by a liquid mobile phase through an analytical column full of porous gel particles, where diffusion-controlled separation of the macromolecular components occurs, and is ultimately observed by different detectors as each slice of sample elutes. A common advanced detection GPC/SEC setup includes refractive index, viscometer, and light scattering detectors.
This application note will describe the analysis of a series of dextran samples ranging in molecular weight from about 1 – 650 kDa. Structural comparisons to other polysaccharides, gum arabic and pectin are presented.
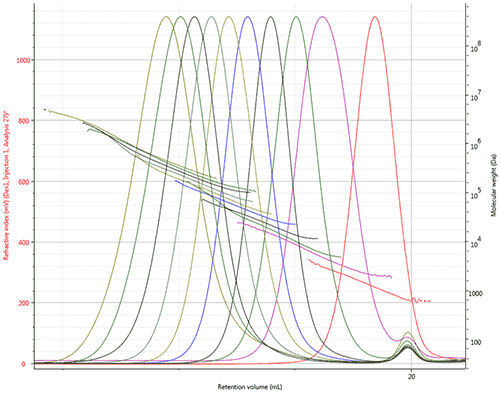
Ten dextran samples were prepared for GPC/SEC analysis in an aqueous mobile phase of 0.05 M Na2SO4. The samples were analyzed using two A6000M columns and a flow rate of 1 mL/min. Figure 2 shows the refractive index chromatograms and LogMW plots for all ten dextran samples. The continual decline of the LogMW plots illustrates the range of molecular weights, from about 1 kDa up to over 1,000 kDa.
|
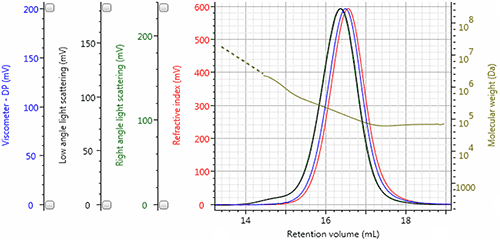
Highlighting the performance of triple detection, the chromatogram of sample Dex7 in Figure 3 displays the refractive index detector signal in red, the viscometer signal in blue, the right angle light scattering (RALS) signal in green, and the low angle light scattering (LALS) in black. The calculated molecular weight at each retention volume is also shown in gold to visualize the sample’s molecular weight distribution.
|
Table 1 presents the molecular data obtained for the series of dextran samples. Presented values include the molecular weight moments (Mn, Mw, and Mz), intrinsic viscosity ([η]), and hydrodynamic radius (Rh).
| Sample ID | Mn (Da) | Mw (Da) | Mz (Da) | PDI | [η] (dL/g) | Rh (nm) | dn/dc |
|---|---|---|---|---|---|---|---|
| Dex1 | 1,109 | 1,278 | 1,486 | 1.152 | 0.0368 | 0.895 | 0.15 |
| Dex2 | 4,312 | 5,553 | 7,319 | 1.288 | 0.0705 | 1.797 | 0.15 |
| Dex3 | 9,677 | 12,220 | 17,820 | 1.263 | 0.1048 | 2.664 | 0.15 |
| Dex4 | 21,200 | 24,190 | 27,800 | 1.141 | 0.1543 | 3.852 | 0.15 |
| Dex5 | 42,480 | 49,520 | 58,750 | 1.166 | 0.2213 | 5.503 | 0.15 |
| Dex6 | 70,700 | 84,530 | 104,400 | 1.196 | 0.2840 | 7.127 | 0.15 |
| Dex7 | 125,400 | 153,000 | 207,800 | 1.220 | 0.3790 | 9.527 | 0.15 |
| Dex8 | 206,200 | 269,000 | 425,000 | 1.305 | 0.4633 | 12.18 | 0.15 |
| Dex9 | 292,100 | 412,000 | 614,300 | 1.411 | 0.5045 | 14.36 | 0.15 |
| Dex10 | 456,500 | 658,500 | 1,087,000 | 1.443 | 0.6045 | 17.74 | 0.15 |
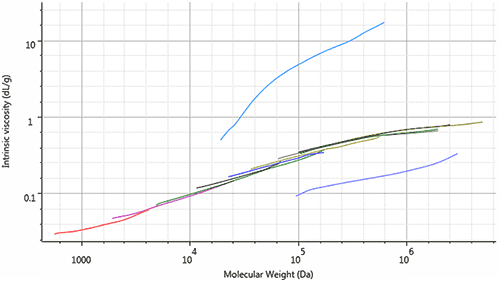
The data in Table 1 confirm the trends shown in Figure 2: the molecular weight, molecular size and intrinsic viscosity of each dextran sample increases throughout the series. An alternate way to view these trends is to observe the Mark-Houwink plot, shown in Figure 4. The Mark-Houwink plot shows the [η] of the sample at each Mw over the entire molecular weight distribution. Samples that have similar structures, but different molecular weights, should fall along the same line on a Mark-Houwink plot. As expected, the Mark-Houwink plots of the dextran samples overlap and form a line that ranges from below 1,000 Da to over 1,000,000 Da.
In contrast, samples with different molecular structures will exist in different spaces on the Mark-Houwink plot, depending on their molecular density. Samples that are more dense in solution exhibit a lower intrinsic viscosity and exist closer to the bottom of the graph, while less dense samples exhibit a higher intrinsic viscosity (like the problematic dextrans that potentially cause acute renal failure) exist toward the top. To highlight this concept, a gum arabic sample and a pectin sample were analyzed for comparison. The gum arabic sample, being a natural gum substance, is more dense than dextran and has a Mark-Houwink plot below that of the dextran series. Pectin, commonly used as a gelling agent, exists higher on the Mark-Houwink plot than dextran. This means that for two samples of the same molecular weight, pectin will have a higher viscosity (as expected for a gelling agent).
|
Malvern’s OMNISEC triple detection GPC/SEC system provides outstanding molecular characterization data for the analysis of a series of dextran samples with molecular weights ranging from about 1 kDa up to over 650 kDa. Structural consistency was demonstrated using the Mark-Houwink plots of the samples. A gum arabic and pectin sample were analyzed to illustrate the structural differences between samples that can be observed. With the data provided by these measurements, researchers now possess greater insight to the molecular characteristics that define the behavior of these indispensable materials and can more accurately control crucial parameters such as molecular weight and structure. This allows better targeting of dextran products and grades to the applications for which they are best suited.