This application note will describe the analysis of three polysaccharide samples using advanced detection. Comparisons will be made between the three highlighting the advantages of advanced detection.
Polysaccharides are abundant, biological polymers composed of monosaccharides, or sugars. As a diverse class of naturally-occurring materials, polysaccharides have been used in applications ranging from paper and cotton manufacturing, to bioprinting and bioengineering, to pharmaceuticals, gelling agents in food, and other consumer products. In order to produce these items, manufacturers and researchers have to be able to isolate and identify polysaccharides with particular molecular properties, such as molecular weight, intrinsic viscosity, and molecular size, that are appropriate for each specific application. As such, the accurate analysis and molecular weight characterization of polysaccharides is critical.
Gel permeation chromatography (GPC) or, equivalently, size-exclusion chromatography (SEC), is a widely used technique to characterize a range of macromolecules, from bulk manufactured materials to natural polymers and proteins. This technique can be used to measure the molecular weight moments (Mw, Mn), dispersity (Mw/Mn), intrinsic viscosity (IV) and hydrodynamic radius (RH) of these macromolecules. Figure 1 shows a complete setup of Malvern’s OMNISEC GPC/SEC system.
A brief overview of how GPC/SEC works: a solvated sample is carried by a liquid mobile phase through an analytical column full of porous gel particles, where diffusion-controlled separation of the macromolecular components occurs and is ultimately observed by different detectors as each slice of sample elutes. The samples elute based on molecular size, with the larger molecules eluting first. It is important to remember that the elution order is based on molecular size and not molecular weight. A common advanced detection GPC/SEC setup includes refractive index (RI), viscometer, light scattering detectors, and sometimes a UV/Vis photodiode array detector.
This application note will describe the analysis of three polysaccharide samples using advanced detection GPC/SEC. Comparisons will be made between the three highlighting the advantages of advanced detection over conventional methods with a single detector.
Figure 1: Malvern’s OMNISEC Tetra Detection GPC/SEC System.
Three polysaccharide samples, 1, 2, and 3, were prepared in water at concentrations of about 0.5 mg/mL for GPC/SEC analysis in a mobile phase of phosphate-buffered saline (PBS). The samples were analyzed using 2 × Malvern A6000M columns + 1 × A7000 column at a flow rate of 0.75 mL/min with injection volumes of 100 µL. The triple detector chromatograms for the polysaccharide samples are shown in Figures 2–4. The RI signal is presented in red, the viscometer signal is blue, the right angle light scattering detector is green and the low and light scattering detector is black. LogMW is presented as a gold line. It should be noted that the large peak that extends off-scale on the RI signal is a result of the sample dissolution solvent, in this case water, being different than the mobile phase of PBS.
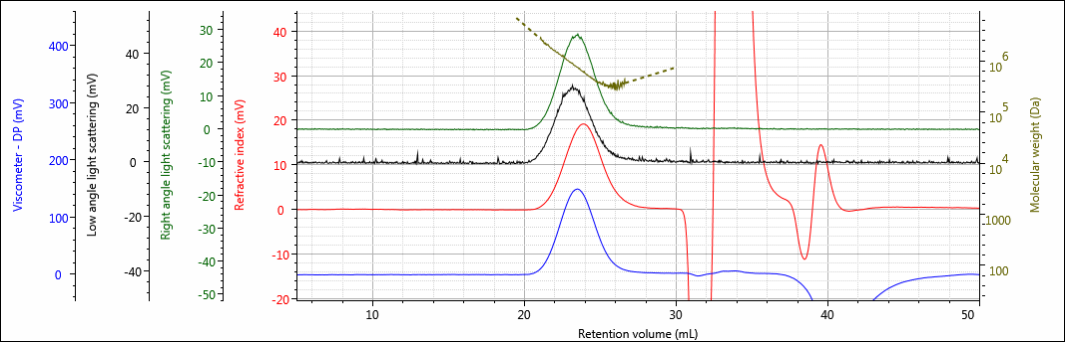
Figure 2: Triple detector chromatogram of sample 1.
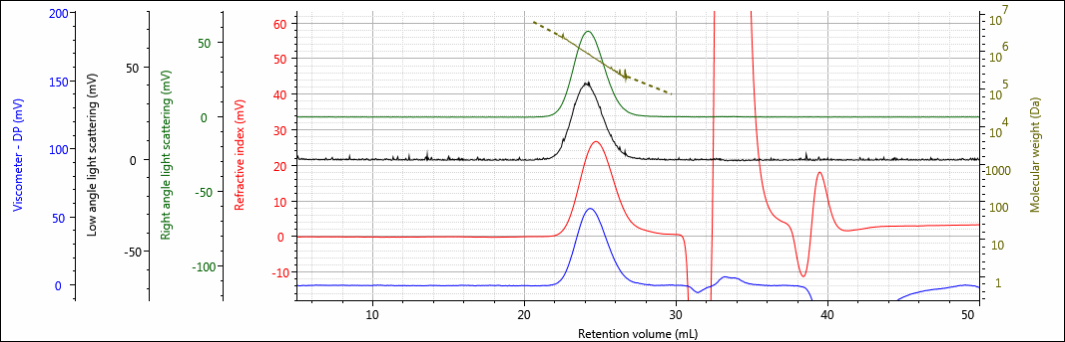
Figure 3: Triple detector chromatogram of sample 2.
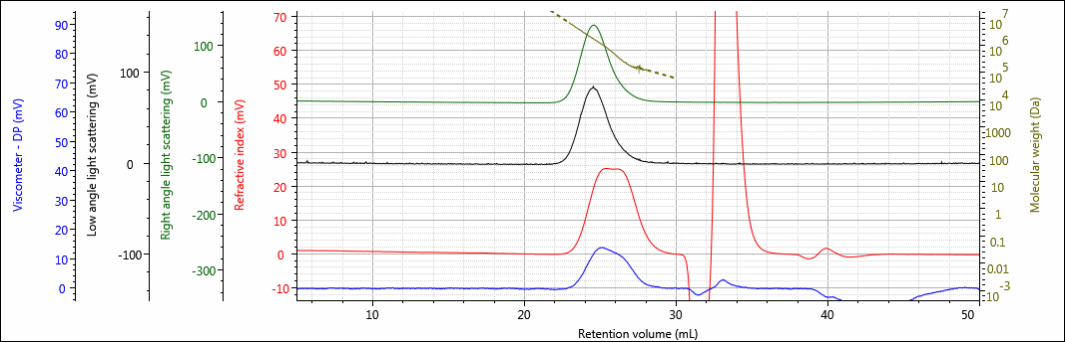
Figure 4: Triple detector chromatogram of sample 3.
All three samples show good chromatography, as evidenced by the detector signals returning to baseline and the consistently decreasing LogMW plot throughout the sample peaks. A cursory examination of the retention volume of each sample indicates that sample 1 elutes at the lowest elution volume (earliest elution time), followed by sample 2, and then finally sample 3. This trend is highlighted in the overlay of the refractive index chromatograms shown in Figure 5.
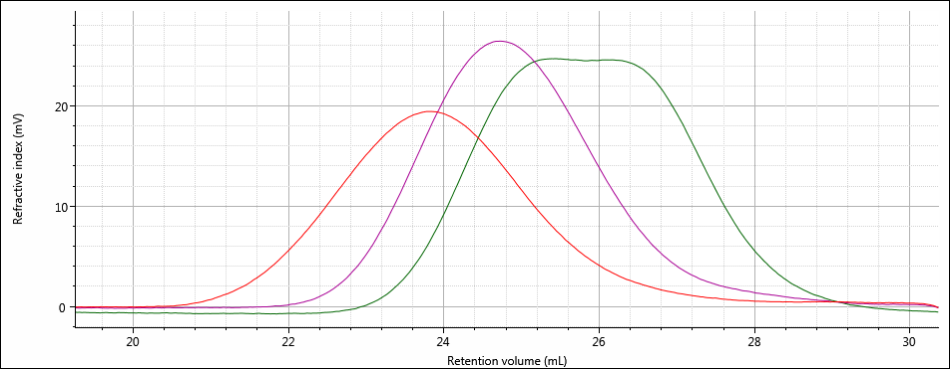
Figure 5: Overlay of refractive index chromatograms of samples 1 (red), 2 (purple) and 3 (green).
The conclusions that can be drawn from this comparison are that sample 1 possesses the largest molecular size of the three samples, followed by sample 2, with sample 3 having the smallest molecular size. It is important to note that the term molecular size was used to make the comparisons based on elution order, not molecular weight. In many cases molecular size and molecular weight follow the same trends, but this is not absolutely true for all samples.
To examine these samples further, the molecular characterization data for samples 1, 2, and 3 are shown below in Table 1. Presented values include Mw, Mn, Mw/Mn, IV and RH. The dn/dc used for analysis was 0.148, typical of polysaccharides in aqueous media. Data for three injections are presented, along with relative standard deviations.
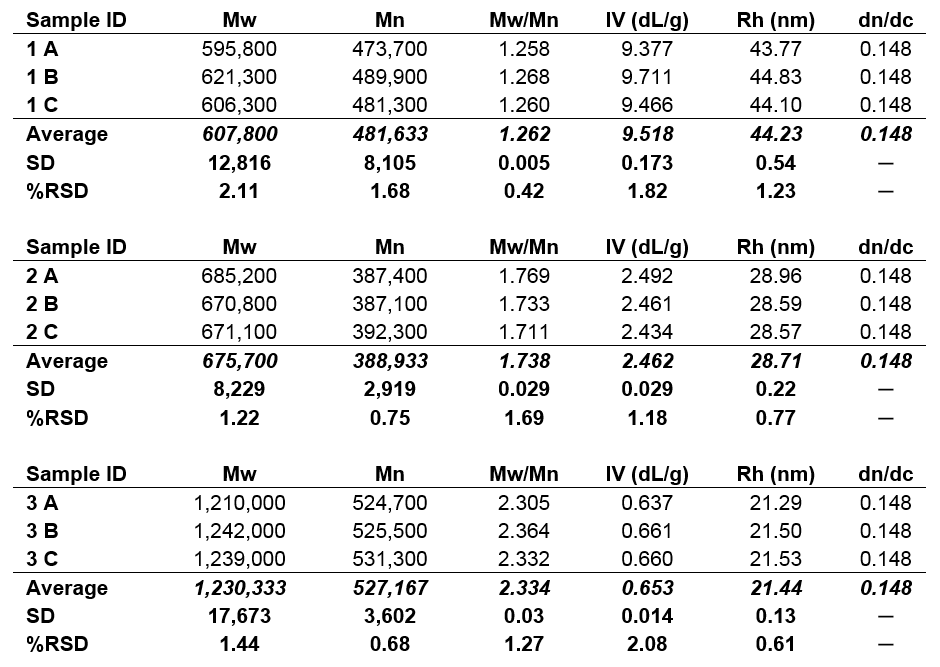
Table 1. Molecular characterization data for samples 1, 2, and 3; Mw, Mn in Da.
As can be seen from the numerical data, the molecular size trend observed from the samples’ elution order is confirmed by the hydrodynamic radius values calculated for each sample. Sample 1 has an RH of about 44 nm, sample 2 has an RH of about 29 nm, and sample 3 has an RH of about 21 nm. However, the molecular weight trend of the samples is the opposite of the molecular size trend. Sample 1 was found to have a molecular weight of about 608 kDa, sample 2 was approximately 676 kDa, and sample 3 had the highest molecular weight, about 1,230 kDa. If this analysis had been done using conventional calibration, which relies upon a single concentration detector and a calibration curve that determines molecular weight based on retention volume, the molecular weight trend would have followed the molecular size trend and provided inaccurate data. The use of advanced detection, which employs a light scattering detector to measure absolute molecular weight independent of retention volume, offers accurate molecular weight data and reveals the true nature of these samples.
The seemingly conflicting molecular size and molecular weight trends are best visualized using a Mark-Houwink-Sakurada (MHS) plot. The MHS plot displays data from two detectors, the viscometer (IV) and light scattering (MW) detectors, on logarithmic scales in order to highlight differences or similarities between different molecular structures. The MHS plots of all three samples are presented in Figure 6.
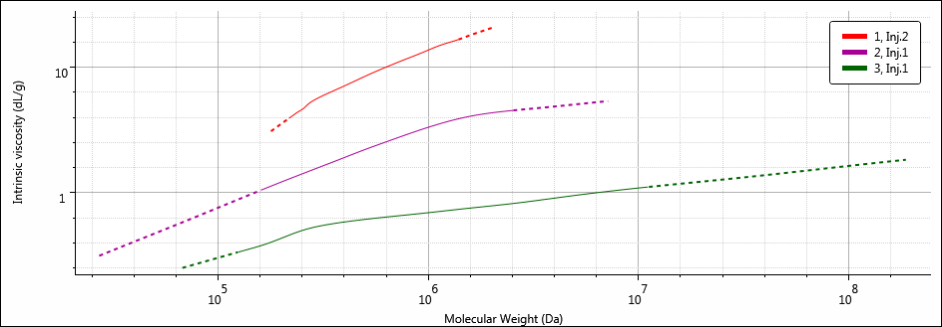
Figure 6: MHS overlay of samples 1 (red), 2 (purple) and 3 (green).
By placing IV on the y-axis, the MHS plot essentially offers a view of the molecular density for the entire molecular weight range of a sample. This is because the units for IV are dL/g, or volume/mass. As IV increases, molecular density decreases. Therefore, on the MHS plot, the densest materials exist at the bottom of the plot. As expected based on the differences in calculated molecular data, samples 1, 2, and 3 have different MHS plots. The width of the MHS plots corresponds to the breadth of the molecular weight distribution of each sample, particularly the high molecular weight end on the right. Sample 3 has the highest MW, which corresponds to the MHS plot that extends the furthest along the x-axis. Since sample 3 also has the smallest RH, it is the densest of the three samples, and as such, its plot is the closest to the bottom of the three (it’s easy to remember: items with high density sink down, items with low density float up). The opposites are true for sample 1: it has the lowest MW (and narrowest molecular weight distribution) so the MHS plot for sample 1 is short and ends at the lowest molecular weight value along the x-axis. But since sample 1 has the largest RH, to go with the lowest MW, the molecular density of sample 1 is the lowest of the three, which places its MHS plot at the top. Sample 2 is intermediate in all of its molecular parameters, and its MHS plot sits nicely between those of samples 1 and 3.
In this way, the MHS plot shows how RH and MW are related by the polysaccharide's structure. Sample 3 has the smallest RH, despite its high MW thanks to its dense structure, while sample 1 has the largest RH despite its lower MW thanks to its more open and expanded structure.
The data in this application note elegantly shows the simplest and most important benefit of advanced detection GPC. While conventional calibration has been used successfully for many years, the underlying assumption that RH and MW are tied together is not true. This is particularly important for novel polymers and polymers that are naturally highly variable, such as polysaccharides, as shown here. Advanced detector GPC can not only measure absolute molecular weight, independent of molecular size and retention volume, but also fully characterize the underlying structural differences between samples and molecules.
The ability to accurately determine the MW, as well as the IV and RH, of polysaccharides is critical to provide researchers and manufacturers the information needed in order to develop and produce unique products for specific applications. This kind of insight can help develop better and more valuable products in textiles, pharmaceuticals, food, consumer products and any other industries where these materials are used.