Total scattering experiments using high-energy X-rays on a laboratory system
Introduction
Recent years have shown an increased interest in the study of nanocrystalline materials due to their specific properties for application in e.g. semiconductors, pharmaceuticals and polymers. Structural information about these materials is present as broad, not well defined features in a diffractogram. Analysis of nanomaterials therefore requires a total scattering approach, including both Bragg peaks and diffuse scattering. One of the most promising analytical methods used is atomic pair distribution function (PDF) analysis. Originally, this method was used to study primarily amorphous and highly disordered materials. More recently, it has been used for the analysis of nanostructured materials. Since the method requires short wavelengths to obtain high resolution in real space (well defined interatomic distances), often the measurements are performed at synchrotron facilities, making use of both the high photon energies and the high photon flux that these facilities offer.
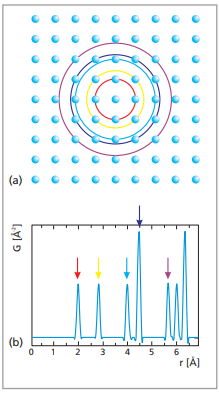
Schematic representation of the construction of the atomic pair distribution function from a square array of atoms [2]. The colored circles (a) indicate the distance from a central atom where a neighboring atom can be found. The arrows indicate the corresponding peaks in the pair distribution function.
Summary
Analyzing powder diffraction data of nanocrystalline and amorphous materials using the atomic pair distribution function (PDF) method provides useful information about the long- and short-range ordering of the atoms in the materials. We have developed the application of PDF analysis on a standard laboratory system employing an X-ray tube with either a silver or a molybdenum anode as X-ray source. Data obtained from a variety of samples are shown. Meaningful results have been achieved, that allowed extracting structural information for comparison with data reported in literature.
Experimental setup
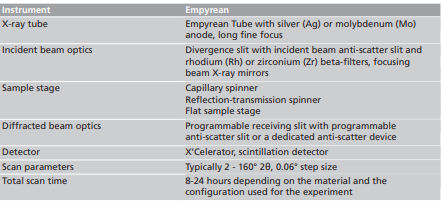
X-ray diffraction measurements were performed on a Malvern Panalytical Empyrean system equipped with a programmable divergence slit, a capillary spinner, a dedicated anti-scatter device, and either X’Celerator detector or a scintillation detector with a programmable receiving slit. The X-ray source was a tube with either silver or molybdenum anode delivering Kα radiation with a wavelength of 0.0561 or 0.0709 nm, respectively.
Additional shielding was applied to the optical path in order to achieve a feature-free background.
The samples were prepared in glass capillaries with a diameter of 2 mm. Scans along the 2θ axis were made up to an angle of 160 degrees corresponding to a scattering vector Q of 22 A-1 when a silver anode is used. The scattering vector is given by: Q = 4π sinθ/λ
Initial data treatment, including background subtraction and optional Kα2 stripping, was done using X’Pert HighScore. For PDF analysis and fitting, we used the software RAD [6] and PDFgui [5].
Instrumental configurations
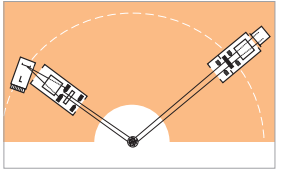
Beam path of the used configuration
Results and discussion
Samples of different nature – crystalline, nanocrystalline, amorphous solid and liquid – were selected to test the applicability of PDF analysis on a standard XRD system. The results of these experiments are described below.
Silicon carbide
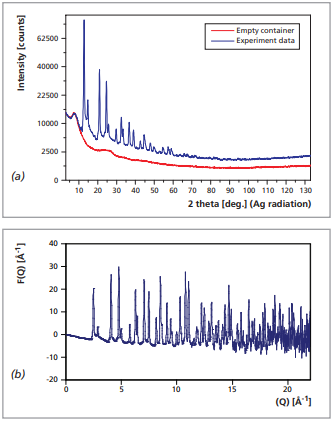
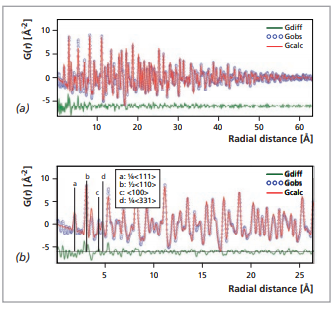
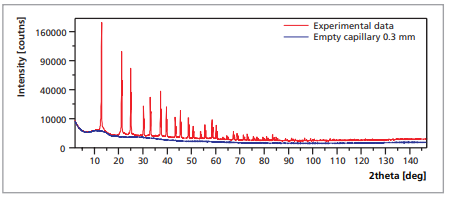
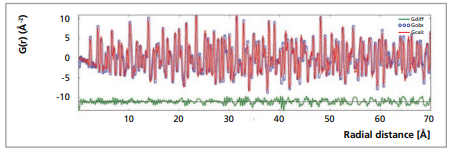
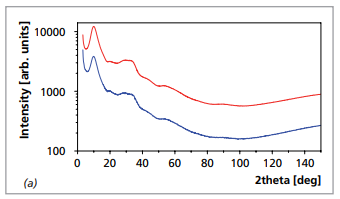
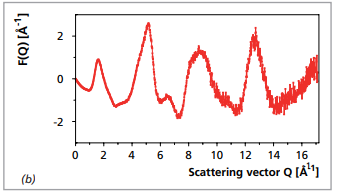
Figure 1a shows a diffraction pattern of silicon carbide powder in a capillary, together with a measurement of an empty capillary. The reduced structure function obtained from the corrected intensity data is shown in Figure 1b. After Fourier transformation the PDF as shown in Figure 2 was obtained. Figure 2b shows the short distances of the PDF in more detail. The maxima in this graph could be identified as the interatomic distances Si-C, Si-Si and C-C, derived from the sphalerite crystal structure of SiC [6]. The relation between the orientation and the interatomic distances in SiC is shown in Table 1.
Figure 1. (a) XRD measurement and (b) reduced structure function of silicon carbide
Figure 2. Experimental (circles) and calculated atomic PDF (red line)
Table 1. Interatomic distances of SiC calculated determined from the experimental PDF (Fig.2)
Results and discussion ctd.
Variable counting time
Measurements performed for PDF analysis typically require long-range scans up to high 2θ angles, where the diffracted intensities are low. Variable counting time (VCT) methods can be applied to spend longer counting times at the high-angle, low-intensity region of the diffractogram at the cost of time spent on the low-angle region. Schematically the redistribution of measurement times is shown in Figure 3. The total measurement time is the same for both situations.
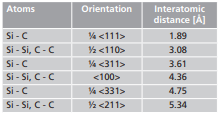
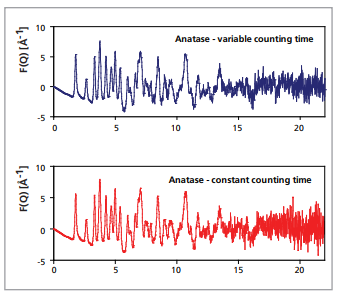
In order to investigate the improvement of data quality at high Q-values, measurements were performed on nanocrystalline anatase (TiO2) with an average particle size of 15 nm using constant and variable measurement times according to the scheme given in Figure 3. The resulting diffractograms and reduced structure functions are shown in Figure 4 and 5 respectively
Figure 3. Constant counting time (left) and variable counting time (right) as a function of 2θ angle
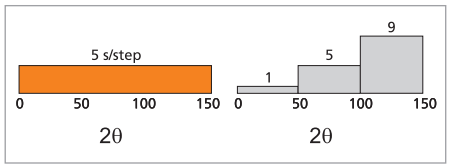
Figure 4. XRD measurements on nanocrystalline anatase measured using (a) constant counting time and (b) variable counting time
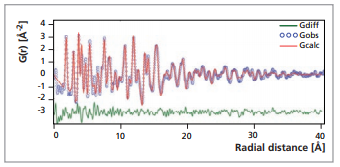
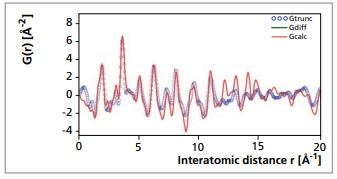
The noise level at high Q-values of the variable counting time measurement is improved in comparison with the constant counting time measurement allowing the observation of additional structure-related features. No reduction in data quality has been observed in the low Q-range. The experimental PDF derived from the VCT experiment is in good agreement with the calculated PDF, as is shown in Figure 6.
Figure 5. Reduced structure functions of anatase, measured using variable and constant counting times
Figure 6. Experimental (circles) and calculated atomic PDF (red line) of nanocrystalline anatase
Focusing miors for high-energy X-rays (Ag and Mo)
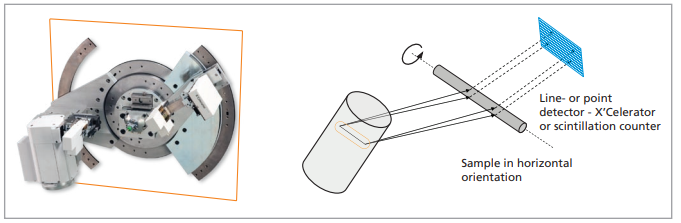
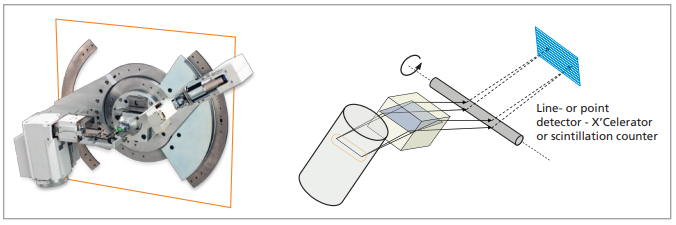
The graded multilayer focusing X-ray mirror is a beam conditioner, which is able to convert the divergent X-ray beam from a tube in line focus position to an intense monochromatic beam that is focused onto the goniometer circle. Experimental configurations for PDF analysis using slit and mirror optics are graphically compared in Figure 7 and 8.
Figure 7: standard configuration using divergent X-ray beam
Figure 8: configuration with a focusing X-ray mirror using convergent X-ray beam
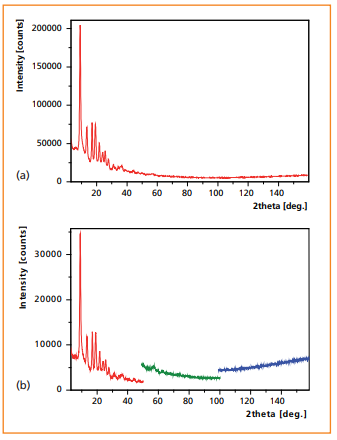
The performance of the focusing X-ray mirror for diffraction measurements in transmission geometry (including PDF analysis) was tested using silicon powder (NIST SRM 640b) prepared in a 0.3 mm glass capilary. Experiments showed that the intensity and angular resolution of the diffraction data collected with the focusing mirror for Mo radiation are suitable for PDF analysis as well as traditional diffraction applications, such as phase analysis.
Figure 9: silicon 640b: raw measurements. Data collected using a focusing mirror for Mo radiation (λ = 0.7093 Å)
Figure 10: experimental PDF of silicon (blue dots) compared with a calculated PDF using the known structure of Si (red line).
Figure 11: angular resolution is comparable to focusing mirror for Cu radiation.
Vanadium oxidee xerogel
Vanadium oxide xerogel (V2O5 nH2O) does not form crystals, that can be analyzed with the use of traditional crystallographic methods. The diffraction pattern (see Figure 12) only shows a combination of Bragg-like peaks and broad diffuse features. The reduced structure function is shown in Figure 13. The PDF, derived from the measurement was compared with the PDF obtained from a structure model described by Petkov et al. [8]. This model describes the crystallites consisting of bilayers of
V2O5, made of square pyramidal VO5 units and separated by water molecules. PDF analysis in Figure 14 shows a good fit at distances in the intralayer region (r < 11 Å) and a not so good agreement in the interlayer region (r > 11 Å). The same observation by Petkov et al. [8] was attributed to the fact that the bilayer slabs are not perfectly stacked, but are turbostratically disordered.
Figure 12. XRD measurement of vanadium oxide xerogel using Mo radiation. Background intensity has been subtracted from the data.
Figure 13. Reduced structure function of vanadium oxide xerogel
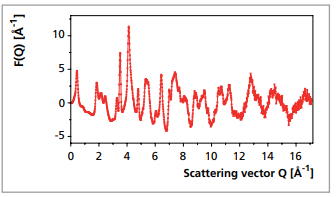
Figure 14. Atomic PDF of vanadiumoxide xerogel. Experimental (circles) and calculated (red line)
Amorphous solids
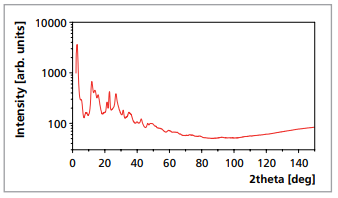
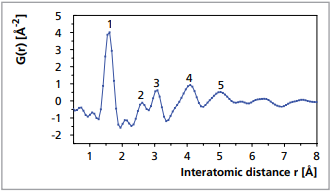
Fumed silica powder was used as an example of applying PDF analysis to amorphous materials. Traditional structure analysis does not give much information; only a few ’humps‘ can be seen in the scan in Figure 15a. After calculating the reduced structure function in Figure 15b more structure can be observed.
PDF analysis of these data helps to reveal the short range order by determining average distances between the nearest neighbouring atoms.
The PDF in Figure 16 shows five clear peaks that could be determined as first and second order Si-Si, O-O or Si-O interatomic distances in silica as given by Mozzi and Warren [9].
Figure 15a. XRD measurement of fumed silica (red line) and empty glass capillary (blue line) performed with Mo radiation
Figure 15b. Reduced structure function calculated from the experimental data from Figure 15a.
Figure 16. Atomic PDF of fumed silica
Liquids
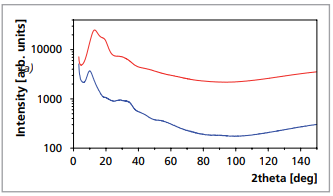
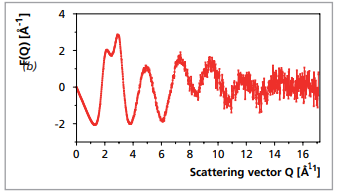
As in amorphous materials, liquids do not have a periodic arrangement of the atoms, and therefore no sharp diffraction maxima are observed in the diffractogram. Figure 18a shows the XRD measurement of tap water as an example. PDF analysis helps to observe the average distance betweens atoms. Calculation of the reduced structure function from this diffractogram reveals the structural information, as can be seen in Figure 18b.
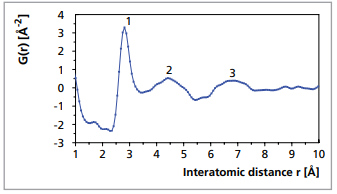
The PDF in Figure 19 shows a relatively narrow peak for the first O-O distance (ca. 2.8 Å). The maxima for the second and third coordination spheres are less sharp. These results are in accordance with the synchrotron data reported by Hura et al. [10].
Figure 18a. XRD measurement of liquid water (red line) and empty glass capillary (blue line) performed with Mo radiation
Figure 18b. Reduced structure function calculated from the experimental data from Figure 17a.
Figure 19. Atomic PDF of liquid water
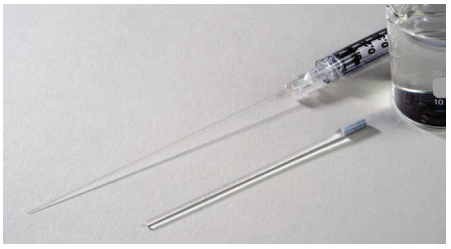
Figure 20. Water sample prepared in a glass capillary
Conclusion
Results of PDF analysis on a range of samples measured on a standard laboratory XRD system, equipped with an X-ray tube with a silver or molybdenum anode, were shown. Meaningful results were achieved, that allowed for comparison with data reported in literature. Empyrean allows performing experiments with both high-energy X-ray radiation and a wide 2θ measurement range and this permitted to obtain data with good quality up to scattering vectors of 17Å-1 (Mo anode) or 22Å-1 (Ag anode). Larger Q-vectors can be obtained by using X-rays with higher energy at synchrotron facilities although in practice values higher than 30 A-1 are rarely used.
The flexibility and the accessibility of the Empyrean system make it the ideal tool for preparation and pre-screening for valuable synchrotron beam time.