Reverse engineering is performed on pharmaceutical tablets to trouble-shoot products falling out of specifications or to understand a tablet's formulation. The particle size distribution of the ingredients that go into making the tablet, especially the active pharmaceutical ingredient (API), is an important parameter and one that is often difficult to access when presented with a finished tablet.
The FPIA-3000 is a fully integrated image acquisition and processing instrument for the analysis of particles in suspensions. Size, shape and intensity parameters are measured from high contrast images acquired in perfect focus thanks to the patented sheath fluid technology. The combination of high image quality and powerful software processing enables the compilation of size, shape and intensity distribution of the whole population from a sample. Additionally, sub-populations can be filtered out based on any of the parameters available allowing results on the remaining population(s) to be obtained.
The FPIA-3000 can therefore provide valuable information about the particle size distribution of API found in tablets separately from other components. In this example, the sub-population of API in a suspension of API and starch was characterized individually.
A suspension of particles is prepared from the tablet of interest. In this example the API and starch remain in suspension, while the other excipients are dissolved.
Since starch particles have a well-defined shape and are generally larger than the API particles, it is possible to identify and exclude the starch particles from the result thereby allowing the particle size distribution of only the API particles to be determined.
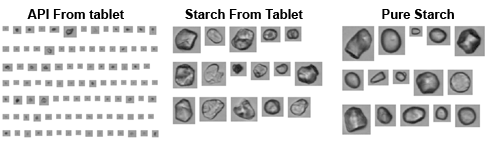
Example images of API and starch particles from an analysis of the tablet are shown in Figure 1 along with example images acquired from an analysis of the pure starch.
There are clear differences between the API and starch particles in terms of size and shape. This allows for the isolation of the API from the starch particles using software filters applied to the results.
|
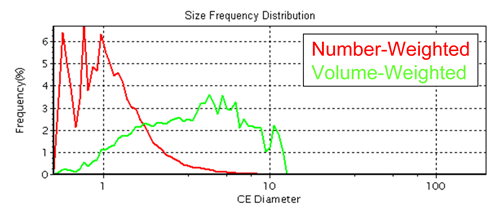
The number- and volume-weighted circle equivalent (CE) diameter particle size distribution of the particles found in the suspensions made from the tablet after filtering the starch particles from the raw data are shown in Figure 2.
|
The large difference in the two curves is indicative of the presence of a small population of large particles; they have a large impact on the volume-weighted size distribution, resulting in the skew to the right observed in the figure.
While the number-weighted size distribution is a more direct representation of the size of individual particles present in the sample, the volume-weighted distribution can be used to compare with size distributions quoted by suppliers, which are traditionally obtained using laser diffraction.
This application note demonstrates how dynamic image analysis allows the API particles used in a tablet to be distinguished from other constituents. The size distribution of the API can therefore be established providing valuable information for reverse engineering.