No single factor affects the life of a gear drive and other moving parts in a machine more than lubricating oil.
It prevents metal-to-metal contact between all sliding and rolling surfaces in a machine, thereby reducing friction and extending its life. Additionally, lubrication oils protect surfaces from corrosive substances, absorb and transfer heat, transport wear particles and contaminants to filters and transmit force and motion in hydraulics.
Industry is placing an increasing reliance on the performance of lubricating oils and on predictive machine maintenance through wear metals analysis. For unused lubricating oils this means analysis for quality control, product development and product performance classification. Whereas for used oils, analysis is needed to evaluate the condition of both the oil and the machine being lubricated.
X-ray fluorescence spectrometry (XRF) is used extensively for the analysis of sulfur in oils, but it is also a powerful tool for the analysis of wear metals in lubricating oils. Simple sample preparation, high accuracy and precision, and good to excellent detection limits across large parts of the periodic table are the principal reasons for this choice.
XRF is a relative technique; therefore oil samples are best quantified against calibrations comprising standards of similar matrix composition. However, the wide variety of lubricating and hydraulic oils, together with their oxidation and degradation over time, means that the matrix composition of used oils is invariably unknown. As a result the analysis of used oils against calibrations defined by unused oil standards often yields inaccurate wear metals concentrations. With Oil-Trace, a single calibration can be used for quantifying additives and wear metals in both unused and used lubricating oils, independent of the hydrocarbon and oxygen characteristics of the matrix and of the sample size (mass and density).
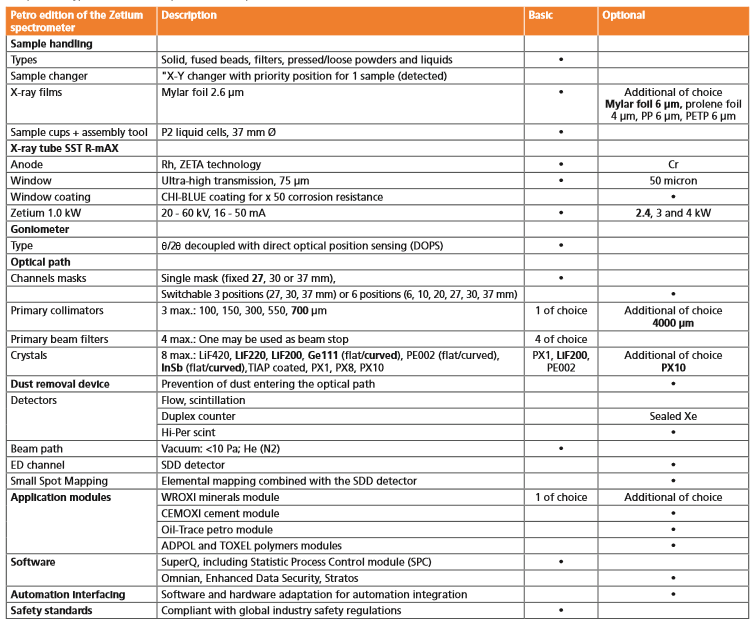
To demonstrate the performance of Oil-Trace in combination with the Petro edition of the Zetium spectrometer, 4 common additives and 13 wear metals were analyzed in used lubricating oils.
A series of commercially available lubricating oil standards from Analytical Services (Texas, U.S.) were used to set up the calibrations for the determination of Na, Mg, Al, Si, P, S, Ca, V, Cr, Mn, Fe, Ni, Cu, Zn, Sn, Ba and Pb in unused and used lubricating oils. The concentration ranges of the elements are listed in Table 2.
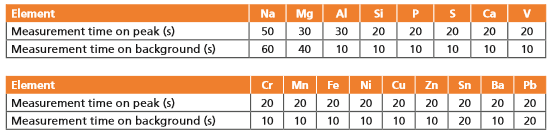
The total measurement time of the analytical program was approximately 11 minutes per sample. Measurement times for the individual peak and background measuring positions are given in Table 1. Single unshared backgrounds were used for most channels and two background positions were used for Na, Mg and Sn. Kα lines were measured for all elements except Ba (Lα) and Pb (Lα). To simplify installation, the SuperQ software
Fifteen grams of each lubricating oil single standard was weighed into a P2 ‘de Kat’ liquid cell, assembled using 2.5 μm polyester (Mylar) supporting foil. This foil was selected to ensure high transmission of the analyte wavelengths for the light elements (like Na and Mg) together with excellent chemical resistance against lubricating oils and their additives.
For the Petro edition of the Zetium spectrometer contains a template for this application and calibration only requires measurement of suitable oil standards.
The Petro edition of the Zetium spectrometer used in this study was upgraded with curved analyzing crystals to further enhance its sensitivity and resolution for Al (PE002 curved), Si (InSb111 curved), P and S (Ge111 curved).
Table 1. Measurement times on peak and background positions
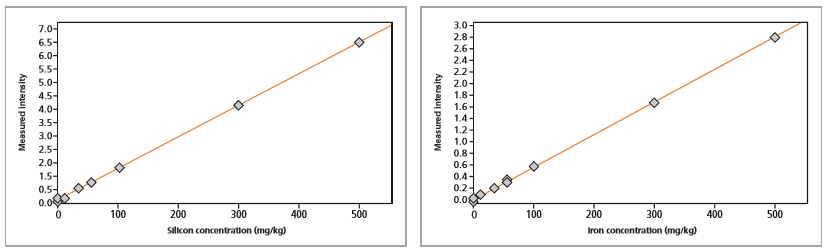
The accuracy of the Petro edition of the Zetium spectrometer with Oil-Trace for the analysis of additives and wear metals in lubricating oils is excellent. This is illustrated by calibration curves for silicon and iron (Figures 1 and 2) and by the calibration RMS values for all the elements (Table 2).
The calibration RMS (1 standard deviation) is a statistical comparison of the certified chemical concentrations of the standards with the concentrations calculated by regression in the calibration procedure
Table 2. Calibration accuracy of 17 additives and wear metals in unused lubricating oils
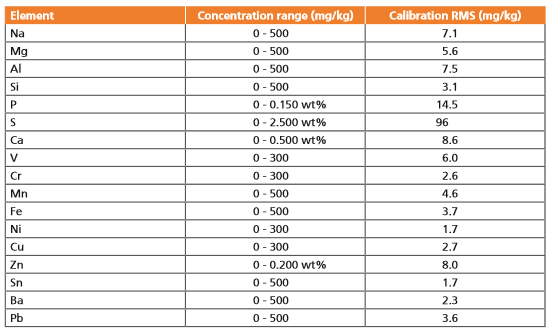
Figure 1. Calibration plot for silicon in unused lubricating oil. Figure 2. Calibration plot for iron in unused lubricating oil
Lubricating oils in machinery oxidize and degrade over time due to heat and friction produced during its operation. This results in a change in the matrix composition of the lubricating oil and a matrix mismatch with the standards used to calibrate the application. Unfortunately, the hydrocarbon and oxygen content of oils cannot be determined directly by XRF due to the foils used to support the sample during analysis. For this reason we call it the ‘Dark-Matrix’. Ignoring differences in the ‘Dark-Matrix’ composition can lead to serious analytical errors (see side box). Traditionally, the only way to avoid such errors was to determine the matrix composition by alternative analytical techniques and enter the data manually before final data reduction.
Oil-Trace uses an innovative method of indirectly characterizing the ‘Dark- Matrix’ composition so that accurate matrix corrections can be made for the analyte elements. This means that single calibrations can be used for quantifying additives and wear metals in unused and used lubricating oils, independent of the variations in ‘Dark- Matrix’ composition caused by aging in used oils.
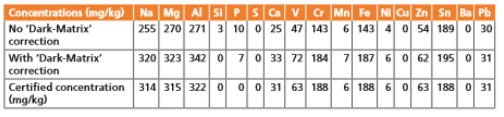
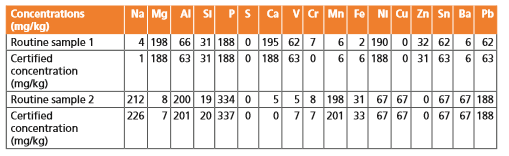
The need for careful characterization of the ‘Dark-Matrix’ is demonstrated in Table 3. In this example, a used lubricating oil was analyzed against calibrations defined by unused lubricating oil standards. The ‘Dark- Matrix’ composition differs between the routine sample and calibration standards, where the major difference is an increased oxygen concentration in the used lubricating oil. If the oxygen content of the matrix is ignored (i.e. no ‘Dark-Matrix’ correction), the calculated concentrations are lower than the certified concentrations (see first row of Table 3). This is especially true for the light elements (Na, Mg and Al).
In contrast, the second row of Table 3 shows a much closer correspondence between the calculated and certified concentrations using the ‘Dark-Matrix’ correction of Oil-Trace.
Table 3. Comparison of certified vs calculated concentrations (with and without Oil-Trace ‘Dark-Matrix’ correction) for wear metals and additives in a used lubricating oil
The accuracy of analyzing used lubricating oils by Oil-Trace is further emphasized by the data shown in Table 4. For most elements the calculated concentrations are within the RMS error of the calibration (see Table 2).
Table 4. Comparison of certified vs calculated concentrations (with Oil-Trace Dark-Matrix correction) for wear metals and additives in two samples of used lubricating oil
The finite thickness characteristics of light matrix oil samples, mean that their analysis is sensitive to density variations between routine samples and standards, and to the volume of oil being analysed. Traditionally, these issues were partially overcome by analyzing a constant weight of material for both calibration standards and routine samples. Varying this amount in an uncontrolled way causes inaccuracies in both calibrations and routine results. Oil-Trace corrects for these inaccuracies by taking into account the amount of sample that is being analyzed.
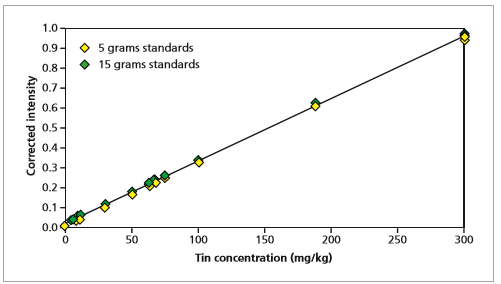
This is accomplished using an integrated FVG correction (see side bar), which can easily handle mass variations of thirty percent or more. This mass independency is illustrated in Figures 3 and 4. Without the wedge-effect correction, 5 g and 15 g of standard material define two distinct calibration curves for tin in lubricating oil (Figure 3). However, application of the wedge-effect correction in Oil-Trace results in a single calibration curve, which is effectively independent of the amount of sample analysed (Figure 4).
Figure 3. No wedge-effect correction: two distinct calibration plots for tin in lubricating oil can be seen for both five and fifteen grams of oil standards.
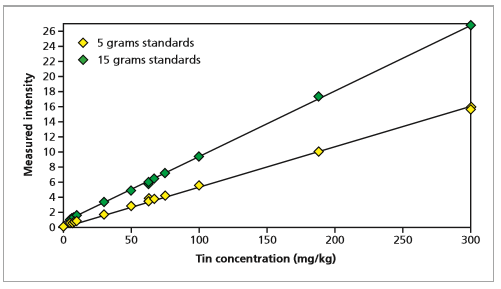
Figure 4. With wedge-effect correction: single calibration plot for tin in lubricating oil using both five and fifteen grams of oil standards to create the calibration
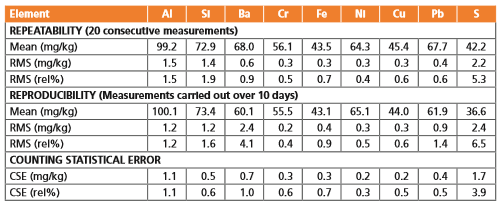
The precision, repeatability and reproducibility of the Petro edition of the Zetium spectrometer are excellent, not only over a short-term period (20 consecutive measurements), but also for longer-term periods (measurements carried out over ten days, Table 5). The short-term repeatability shows RMS values better than 1-2 % at the 40-70 mg/kg level for most elements, for example, Si, Cr, Fe, Ni, Cu and Pb. More importantly, this level of precision was maintained over longer periods, illustrating the long-term stability of the system.
Comparison of the RMS value (1 standard deviation) with the counting statistical error (CSE) shows the excellent precision of the method and the outstanding stability of the instrument (Table 5). Theoretically, the CSE is the minimum possible error and the similar magnitude of the RMS and CSE values shows that errors originating from the instrument are negligible.
Table 5. Analytical precision of Zetium Petro edition
Detection limits for wear metals and additives in typical unused lubricating oil matrices are given in Table 6. The lower limit of detection (LLD) is calculated from:
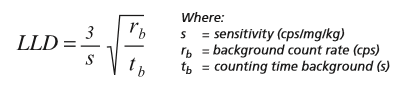
Table 6. Detection limits in typical lubricating oil samples
Components typeset in bold were present in the spectrometer used to obtain the data in this note.
Elemental analysis with XRF is already the key to the control of quality and production processes in the many industries analyzing a wide range of oil products. The Petro edition of the Zetium spectrometer in combination with Oil Trace brings XRF analysis of petroleum products to the next level. Clear improvements to the accuracy of wear metals and additives analysis, required for the control and monitoring of unused and used lubricating oils, have been demonstrated. Oil-Trace performs innovative corrections for variations in the Dark-Matrix composition and the wedge effect. This results in robust calibrations, capable of analyzing different sample types, and in methods insensitive to variations in the amount of sample being analyzed. Finally, the XRF method benefits from a simple sample preparation and the stability of the Petro edition of the Zetium spectrometer is such that that individual calibrations can be used for months. Time-consuming re-standardizations are unnecessary and the resultant data are consistent over time.