
Accurate and correct determination of particle size is very important in both analytical and preparative HPLC. The actual particle size affects important chromatographic parameters such as plate number and resolution and physical parameters such as the pressure drop. For both analytical and preparative chromatographic applications, a correct particle size is necessary to be able to make predictions of the afore mentioned chromatographic and physical parameters. There are many available techniques that cover the size range 3-30 μm, in which almost all analytical and preparative HPLC applications are found today. Most of these techniques are briefly described in a review by Unger.1 Even though all of the techniques listed for measurement of particle size in that review cover the size interval 3-30 μm, some of them render false information since the high porosity of HPLC silica materials make particle size measurements difficult. Typical HPLC silica materials have a pore volume in the range 0.8 - 1.2 cm3/g, which corresponds to a particle porosity of 64-73 %. The electrical sensing zone (Coulter Counter) method is traditionally used to determine the particle size and size distribution data of porous silica particles. Reliable results are produced provided that the instrument used is mass calibrated to compensate for the porosity of the silica particles. However, without mass calibration, the electrical sensing zone method underestimates the particle size for typical bare HPLC silica particles by about 20%.
Automated particle characterization by image analysis on the Sysmex Flow Particle Image Analyzer, FPIA-3000, is an alternative technique for particle sizing which allows verification of the particle size data from the Coulter method and therefore, confirmation that the mass calibration is correct. In addition to information on particle size and size distribution, the Sysmex FPIA-3000 also provides useful information on particle shape which may provide added information to HPLC silica users
|
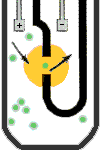
Analysis by the electrical sensing zone (ESZ) method involves particles being dispersed in a weak electrolyte and forced through a small aperture (different diameters can be used) over which a constant current is applied (figure 1). When a particle passes through the aperture, the impedance is suddenly increased and gives rise to a voltage pulse according to Ohm´s law. The height of every voltage pulse generated by a single particle is proportional to the particle volume. For each instrument, a calibration constant, Kd, is used to translate the voltage readings to the corresponding particle diameters. Provided that the particles to be analyzed by the ESZ method are perfectly spherical and non-porous it is easy to use the data from a Coulter Counter directly and obtain correct particle size data.
High quality HPLC silica materials are perfectly spherical, however, they are porous. Therefore, when dispersed in the dilute electrolyte solution used in the ESZ method, the electrolyte permeates the particle which increases the electrical conductivity of the porous particle relative to a non-porous particle of the same size. Porous particles thus generate smaller voltage pulses than non-porous particles of the same size. The problem associated with porous particles when using the ESZ method has been known for a long time.2 In 1983 a British standard, BS 3406:5, was published in which mass calibration of the Coulter Counter was described.3 Performing a mass calibration of the ESZ instrument allows for compensation of the porosity of particles by adjusting the calibration constant, Kd. The undersized particle diameter is then multiplied by the adjusted Kd-value whereby the correct particle size is obtained. Mass calibration of the Coulter Counter is well described in the literature4 and in the ISO standard ISO 133319.5.
Particle characterization by automated image analysis is another technique for accurate particle sizing. Image analysis of chromatographic media was studied in the 1980's by Göransson and Dagerus.6 They prepared microscope slides manually for each sample, and counted around 100-200 particles per slide by using an early version of an image capturing program with a digitizing function. This was a very time-consuming way of measuring particle size.
The method was also very dependent on the operator skills to prepare a perfect monolayer of particles and to get the particles in focus. Since then different automated image analyzers have appeared on the market. Jia and Williams7 reported on the progress of the field of automated image analysis in a review article.
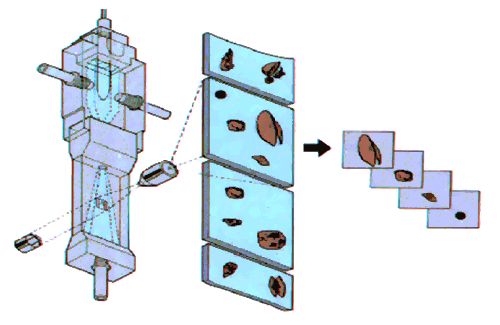
The Sysmex FPIA-3000 image analysis instrument automatically analyzes dilute particle dispersions and also provides information on particle morphology. Particles pass through a flow cell which hydrodynamically focuses them with consistent orientation so their largest faces are presented towards the camera (Figure2).
|
|
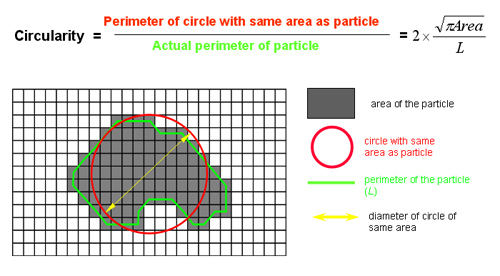
Images of the particles are captured and a number of morphological parameters such as size and circularity are calculated (Figure 3) .Circularity is the measure to determine the proportion of non-spherical shaped particles in a sample. For spherical shaped particles the circularity value is 1.0, and for irregularly shaped particles it is has a lower value. Additionally images of every particle analyzed are stored.
Different Kromasil 100 Å bare silica materials (Eka Chemicals, Sweden) were used for the measurements. Particle sizes ranged from 3.5 mm to 25 mm. Kromasil 100 Å has a pore volume of about 0.9 cm3/g. Two special qualities of spherical porous silica were intentionally prepared for calibration of the ESZ instrument. One of these materials was made with a very low pore volume, about 0.50 cm3/g, and one with a high pore volume, about 1.20 cm3/g. In this way the pore volume interval, to be used in the mass calibration of ESZ instrument, was significantly broadened. In total, five different silica materials with different porosity were used in the mass calibration of the ESZ instrument.
A portion of one of the samples was deliberately crushed in order to create a significant number of non-spherical particles in the sample. This sample was also analyzed on the Sysmex FPIA-3000 to determine the amount of non-spherical particles.
Samples analyzed on the ESZ instrument (previously mass calibrated) were prepared by dispersion in isotan solution with an ultrasonic tip for 30 sec.
For the Sysmex FPIA-3000 analyses, the samples were wetted with 5% wt% solution of Igepal CA-630 and dispersed in deionized water with 30 sec ultrasound.
Most HPLC silica manufactures report the median diameter by volume (Dv50) along with a measure of the particle size distribution which in most cases is a ratio between the dv90 and the Dv10 (Dv90/Dv10).
Table 1 shows particle size data obtained by the ESZ and Sysmex FPIA-3000 methods. The results show that the Sysmex FPIA-3000 gives very similar values for Dv50 to the ESZ and almost identical particle size distributions. Therefore, it can be concluded that the correct mass calibration of the ESZ instrument has been made. As mentioned before, the Sysmex FPIA-3000 also provides information on the particle morphology of the analyzed samples.
FPIA-3000 | FPIA-3000 | ESZ | ESZ | |
|---|---|---|---|---|
Sample No. | Dv50 [µm] | Dv90/Dv10 | Dv50 [µm] | Dv90/Dv10 |
1 | 3.67 | 1.37 | 3.86 | 1.41 |
2 | 3.54 | 1.44 | 3.70 | 1.39 |
3 | 3.29 | 1.39 | 3.67 | 1.38 |
4 | 5.69 | 1.45 | 6.06 | 1.44 |
5 | 5.80 | 1.42 | 6.04 | 1.42 |
6 | 9.57 | 1.58 | 9.96 | 1.55 |
7 | 9.36 | 1.38 | 9.54 | 1.36 |
8 | 12.59 | 1.65 | 13.00 | 1.64 |
9 | 24.72 | 1.48 | 25.03 | 1.49 |
|
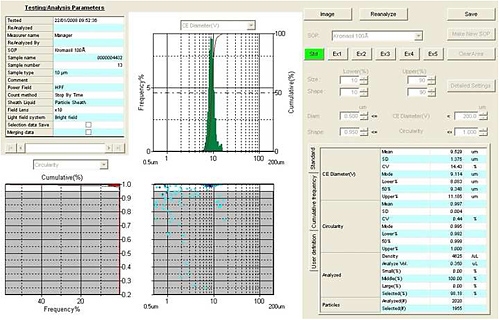
Figure 4 shows how a summary report appears on the screen. The circularity distribution is shown in red and the size distribution in green. In blue is a scattergram in which the circularity is plotted against particle size.
|
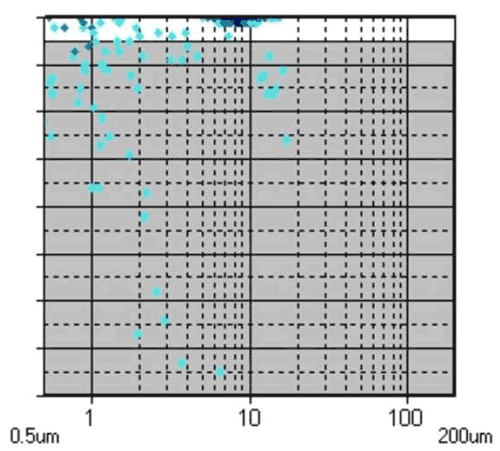
Figure 5 shows an example of a size vs circularity scattergram for one of the Kromasil sample. Almost all of the particles are concentrated to a circularity value close to 1.0 at a particle size close to 10 μm in this figure. This creates a dark spot that in this case represents almost 2000 particles.
|
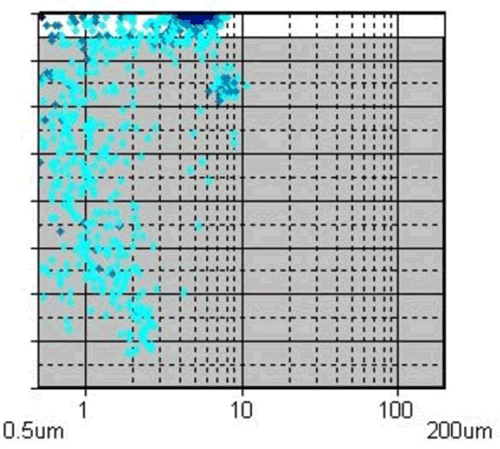
In contrast, Figure 6 shows an example scattergram plot for the material in which a fraction of the particles have been deliberately crushed. The figure shows that a have a circularity value lower than 1.0, which means that they are not spherical. The particle count in the summary report showed that about 15% by number of the particles in this sample had been crushed. When substantial proportion of the particles making large batches of HPLC silica it is clear that an instrument like Sysmex FPIA-3000 adds value to the work on quality assurance in the production process. Since images of all of the particles analyzed on the Sysmex FPIA -3000 are saved they can also be viewed manually. If they are presented in the order that they are detected, a random pick of particles is obtained, i.e. a statistical selection of particles which displays a representative view of he physical appearance of the analyzed particles.
|
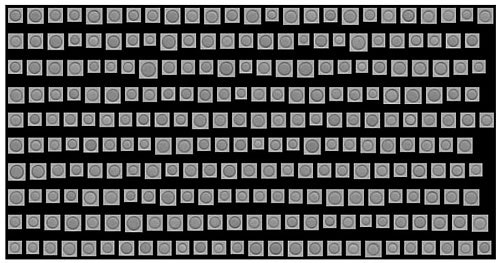
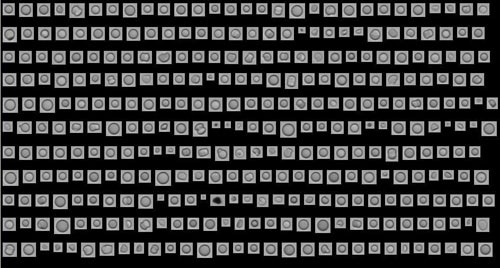
Figure 7 shows an example of this feature for an approved Kromasil 100 Å batch with a particle size of 10 μm. Figure 8 shows particle images from the sample in which some of the particles had been crushed prior to analysis. It can easily be seen that a proportion of the particles are not spherical. About 200 particle images are displayed at one time, which is enough to easily detect when the share of non-spherical shaped particles exceed 5% by number.
It is therefore, possible to critically examine the quantitative data on the proportion of non-spherical shaped particles in a sample from a Sysmex FPIA-3000 result.
|
Particle size is important for both analytical and preparative chromatography applications. The electrical sensing zone technique is an established method to determine the particle size and size distribution of porous silica particles. In order to ensure correct values of the particle size it is vital to use mass calibration to compensate for the porosity of the silica particles. If non-porous particles are used to calibrate ESZ instruments, the resulting values of Dv50 will be about 20% smaller than the real values.
Characterization of the silica particles using automated Image analysis on the Sysmex FPIA-3000 gives similar Dv50 values compared with ESZ instrument, and almost identical size distributions. The Sysmex FPIA-3000 is therefore, a good reference technique for validating that the mass calibration has been carried out correctly on the ESZ instrument. Additionally the Circularity results and particle images provided further quantitative and qualitative data about the samples.
This study was carried out by Anders Torncrona of Eka Chemicals Sweden. (Anders.Torncrona@akzonobel.com)
K.K. Unger, R. Skudas, M.M. Schulte, J. Chromatogr. A, 1184 (2008) 393
T. Allen, Particle Size Measurement, Chapman and Hall Ltd, London, 1968
British Standard 3406:5, 1983, Electrical Sensing Zone Method
M.M. Figueiredo, M.G. Rasteiro, C. Santos, C. Monteiro, Part. Part. Syst. Charact. 8 (1991) 294
ISO 133319, Determination of Particle Size Distributions - Electrical Sensing Zone Method , 2000
B. Göransson, E. Dagerus, in P.J. Lloyd (Editor), Particle Size Analysis. John Wiley & Sons Ltd., 1988, p. 159
X. Jia, R.A. Williams, Pharm. Tech. Europe, Dec. (2005) 29