
In this application note, well known protein samples were used in a cross-contamination test to investigate the accuracy and repeatability of the Zetasizer APS dynamic light scattering (DLS) system.
The protein samples used in this study were insulin, measured both in its storage form (the insulin hexamer) and in the form of larger aggregates. In addition to Insulin, another protein was measured. This protein, the 42 amino acid long amyloid beta peptide (Abeta) was measured. Abeta is well-known to be sticky and adheres to plastic, making it a good test for the cleanliness of the sampling system. The Abeta sample was present in two forms, a fibrillar form and an oligomeric form.
The Zetasizer APS is designed to have a specific measurement cell of high quality quartz and optimal temperature regulation that enables the user to easily perform accurate and repeatable measurements. The degree of accuracy is dependent upon the precision of the temperature control and the optical quality of the measurement cell. The careful sampling and the stable thermal control allows reproducible measurements from wells containing the same sample to be performed.
The samples were measured using a 96 well Corning Costar plate, but any other plate with standard inter-well distance and plate height can be used. The sample from each well was aspirated to the measurement flow cell. The sample was equilibrated for 20 seconds before the measurement was started to ensure thermal equilibration had occurred. Each sample was measured in triplicate and the measurement duration was determined automatically by the software to ensure optimal data quality.
After measurement, the samples were sent to waste, and the flow system was cleaned by using a custom wash: 1 syringe volume of deionised water (1250µl), then 3 syringe volumes of 1M NaOH and finally 4 syringe volumes of deionised water to ensure that there was no NaOH left in the system.
The plate was loaded in the following manner:
Monomeric insulin in wells D1-3, E1, E3, E5, E7, E9, F1, F3, F5, F7, F9, H10-12
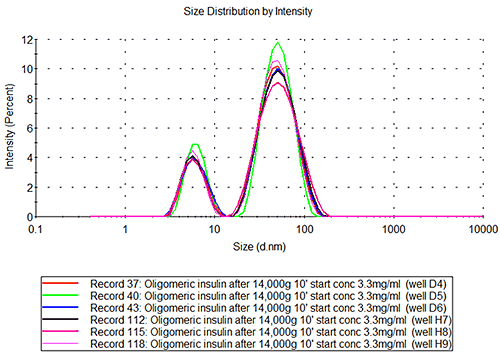
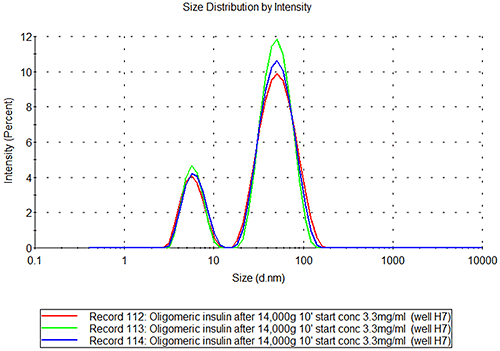
Oligomeric insulin in wells D4-6, H7-9
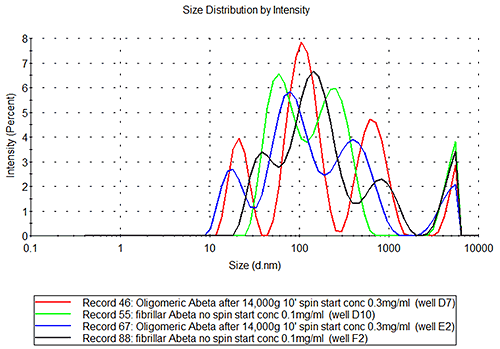
Oligomeric Abeta peptide in wells D7-9, E2, E4
Fibrillar Abeta in wells D10-12, F2, F4, F6, F8
|
|
|
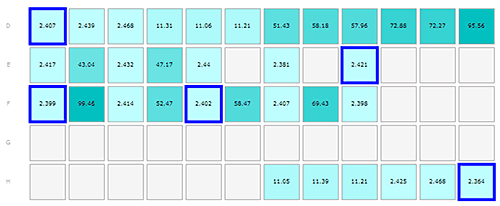
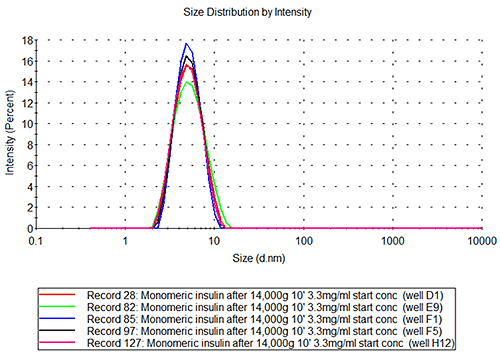
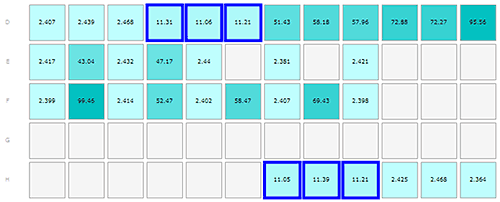
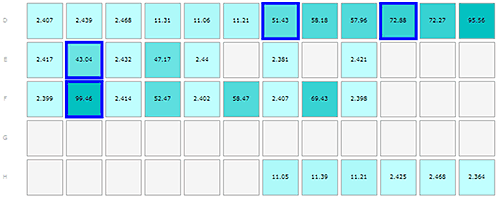
The results from the insulin and Abeta samples are shown in figures 1-3, where the layout of the plate is shown as part A of each figure to allow the reader to locate where in the plate the sample was kept. Each row of cells was sampled from left to right, the rows being sampled in alphabetical order.
The mean hydrodynamic radius for the monomeric insulin obtained in these measurements is 2.71+/-0.06 nm, which results in an estimated molecular weight of 34.7+/-1.8kDa. This value correlates well with the known molecular weight for the hexameric insulin of 34.848kDa.
|
|
|
The insulin aggregate samples show a bimodal distribution, see figure 2B, where the small peak is of the same size as the peak in the monomeric insulin sample. The second peak has a radius of 27+/-0.8nm which would correspond to a globular protein of about 7.5MDa. If the aggregate is non-globular, e.g. an extended structure, the measured size will correspond to a much lower molecular weight structure.
|
|
|
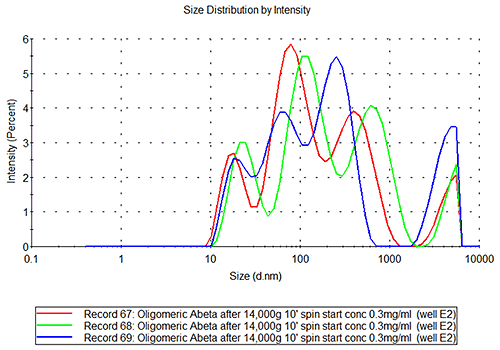
In the case of the oligomeric and fibrillar Abeta samples, it is clear from figure 3B that these are not as repeatable or reproducible as seen for the insulin samples. The inherent character of these samples is different. If the repeatability of measurements of the sample in well E2 is studied, see figure 3C, it is clear that the sample is polydisperse, the inter-replicate variation observed being typical of samples where several populations of different species are present at the same time, (such as the monomer, small oligomers, filaments and fibrils etc.) and the relative amount of each population may be changing over time.
These measurements show that the Zetasizer APS is definitely able to give repeatable and reproducible size measurements using DLS for stable protein samples.
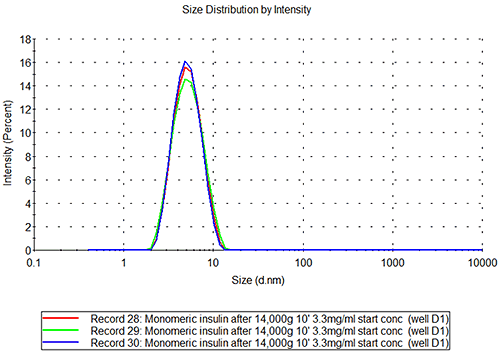
The insulin data show that the well-to-well variation is as low as the variation between repeat measurements of the same sample. The value obtained for the molecular hydrodynamic size corresponds well with the expected size based on the known molecular weight.