
See how you can use DSC to save you money in your contract development lab.
The ability to develop protein therapeutics within the aggressive timelines often requested by sponsors requires that contract development organizations employ a structured approach to preformulation development. A key component in this strategy is the ability to rapidly characterize the thermal and chemical stability of a biomolecule and capillary differential scanning calorimetry (DSC) has proven to be an excellent tool that provides this data in real or near-real time. This paper provides an overview of the workflow typically associated with preformulation projects at a contract development organization as well as provides a general framework for conducting preformulation studies that leverages the application of biophysical techniques such as DSC and traditional analytics by employing statistical design. A case study involving the formulation development of a monoclonal antibody is presented to detail the utility and potential limitations of DSC in support of preformulation for a variety of protein products.
Although biopharmaceuticals represent a rapidly growing segment for ethical products, the ability to progress these products from research to development and ultimately manufactured products can be hindered by the complex structures and multiple degradation pathways that are associated with biopolymers.1,2,3
Traditional pharmaceutical development has often relied on real-time stability studies and standard analytics to develop product formulations that confer the two year shelf life typically required for drug products. Although these approaches have proven useful, there is a need to develop and apply techniques that report on the structural stability of biopharmaceuticals and reduce the need to rely on real-time stability studies so extensively. Differential scanning calorimetry, which monitors the apparent excess heat capacity of a protein solution as a function of temperature, is one of several tools that have been proven to be useful in this setting. 4,5 Even when used in a comparative or rank-ordered fashion DSC can provide data on protein stability that correlates well with real-time stability studies.
A key element in the ability to apply DSC or any other technique that may report on protein structure or stability is an organized approach that allows for the rigorous statistical evaluation of preformulation data. Recent regulatory guidance6 has highlighted the need both for well-characterized biopharmaceutical products as well as a systematic development approach that allows for the understanding of both critical parameters that affect product stability as well as any interactions between those factors that may exist. Here we describe a systematic approach to preformulation development that leverages biophysical characterization and standard analytics in the context of statistical design with the goal of shortening the pharmaceutical development cycle while improving the quality of the development studies.
A variety of techniques that are capable of monitoring either protein secondary or tertiary structure have been extensively used in support of protein preformulation development; although this is not an exhaustive list, these include differential scanning calorimetry (DSC), circular dichroism (CD), Fourier-transform infrared spectroscopy (FTIR), and fluorescence spectroscopy.7,8,9 While each of these techniques has its advantages and disadvantages, we have found DSC to be one of the more generally applicable biophysical techniques for preformulation development for the following reasons: most proteins exhibit measureable thermal transitions during unfolding, the technique is relatively insensitive to a variety of potential buffer components and there is no requirement to know the protein structure or relative proportion of alpha-helical or beta-sheet segments in order to generate useful preformulation data.
In addition to DSC or other biophysical techniques, however, standard analytical techniques are also employed to more fully understand product quality in the context of accelerated stability studies. The suite of analytical tools typically includes size exclusion chromatography (SEC) for the detection of aggregates, ion exchange (IEX) for monitoring charge variants and deamidation, peptide mapping with mass spectrometry for chemical degradants and either SDS-PAGE or capillary gel electrophoresis (CGE) for monitoring covalent aggregates and degradants.
The system that our organization employs extensively to provide an organized framework for experimental design and data interpretation is design of experiments (DOE),10 because it maximizes the quantitative nature of DSC and many of the standard analytical techniques used during preformulation. DOE allows for the identification and statistical assessment of critical factors and their interactions and an example of a DOE interaction plot is shown in Figure 1. The data in Figure 1 illustrate the effect of buffer type and pH on aggregation as assessed by size exclusion chromatography. Had either buffer system alone been used for the pH study, one would have incorrectly concluded that pH either did or did not have an effect on aggregation; however, by conducting a DOE it was possible to demonstrate that an interaction exists between pH and buffer type which was helpful in ruling out one buffer system for subsequent studies.
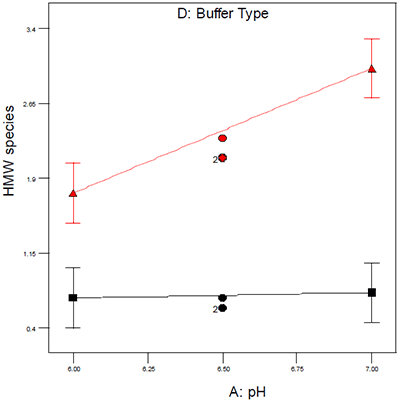
|
The type of design selected usually reflects the level of understanding and/or place in the product development lifecycle for a particular therapeutic: for pre-clinical products or products where there is limited information, factorial or fractional factorial designs are used to identify critical factors/interactions from a larger set of potential factors. For later-stage products or those products where some initial studies to identify critical factors have been performed, response surface designs such as central composite or Box-Behnken designs are more suitable because those designs offer greater granularity within the design space and can be used to model complex or quadratic surfaces.
In addition to the desire to more rapidly develop products, biopharmaceutical manufacturers also have a strong desire to leverage core competencies and create economy of scale across multiple products and processes. For preformulation activities in a contract development setting, this has evolved into a defined workflow designed to clarify scope, timelines and deliverables at each point in the development process. A high-level example of a typical preformulation project is shown in Figure 2 and will be discussed in more detail in the following sections:
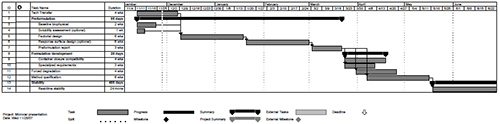
|
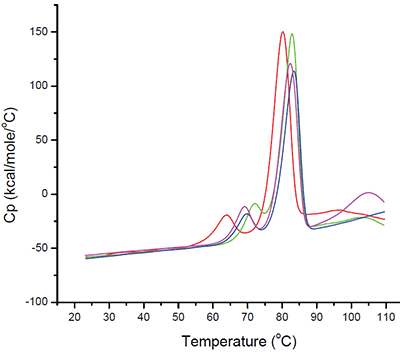
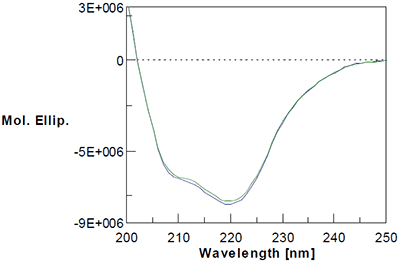
During the initial stages of preformulation development, several candidate biophysical techniques are employed as part of a “baseline biophysical” study (Figures 3 and 4) to assess their utility and those techniques found to be suitable for a particular molecule are then used as part of a screening design. Because of its general applicability to a wide variety of proteins and tolerance for a large number of buffers and excipients, DSC is almost always found to be suitable for both the initial and subsequent preformulation studies. The goals of this initial task are twofold: first it allows identification of the most suitable techniques for a particular molecule while giving the formulation scientist a chance to optimize and standardize acquisition parameters and more importantly, it allows the scientist to eliminate categoric factors that do not appear to be suitable for a particular molecule so subsequent designs are centered around buffer, pH and ionic strength regimes where the molecule appears to be most stable.
|
|
Increasingly, sponsors are requesting solubility studies to generate high concentration (>100 mg/mL) therapeutics because more concentrated drug products allow in-home administration as opposed to restricting administration solely to a clinical setting. While appealing from a marketing point of view, the need for high concentrations where the same dose is delivered in a small volume places extreme demands on the stability of the protein therapeutic. These studies often employ a variety of pH and buffer candidates, typically with a variety of potential excipients.
It is important to note, however, that conditions where the molecule is most soluble do not necessarily reflect conditions where the therapeutic is most stable.
Statistical design has gained increasing regulatory6 and industry11,12 acceptance, and both the FDA and ICH recommend the use of statistical design during pharmaceutical development to better characterize critical factors that may impact product stability as well as interactions between those factors which are not discernable using a one factor at a time (OFAT) approach. There are two general classes of statistical designs that are frequently employed during development: factorial designs and response surface designs. Factorial designs are used when the primary goals of the study are to identify the critical factors and their interactions. Response surface designs, by contrast, are more often used later during development when critical factors have been identified but the development scientists need to optimize the process and establish suitable ranges for manufacturing. Because of its excellent repeatability and intermediate precision, DSC fits well with either of these statistical designs and even factors that have fairly subtle effects on product stability can be identified and optimized.
For each numeric factor in the design, factorial designs are typically set up as low (-) and high-coded (+) values that are decided by the user based on a series of initial studies (in this case the baseline biophysical studies). It follows for a two-level factorial design with all numeric factors that the number of runs is given by:
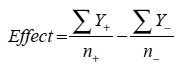
For a two-level three factor design, this would translate into a minimum of eight runs. For any given factor, however, runs that are set to each level are averaged to estimate the effect of that factor using the equation below, meaning that an eight-run DOE has the statistical power of an OFAT experiment with sixteen runs:
|
where Y is the response at the low (-) and high (+) levels and n refers to the number of data points collected at each level In addition to the core design, however, it is advisable to employ three to four center points to estimate curvature within the design space and to allow for a more robust estimation of error.
Central composite designs are response surface designs that are essentially “augmented” factorial designs: they are built around a core factorial design to which has been added a series of “star” or axial points that project outside of the core factorial design space and more easily allow for the identification of effects because they span a wider range than is included within the factorial design. Additional replicates are also added at the center points that allow for error estimation.
Between the center points, factorial design and axial points, central composite designs have a total of 5 levels that are varied for each individual factor, giving a very high degree of granularity to these designs that allows the use of quadratic functions during the optimization phase of preformulation.
Either the factorial or central composite designs are applied as accelerated stability studies where the stress conditions have been selected based on the thermal transitions for a particular therapeutic. For antibodies, there are typically two to three unfolding transitions corresponding to the CH2, CH3 and FAb domains, respectively and the stress temperature employed for the study is targeted to be below the onset of the first observed unfolding transition. The goal of the study is to induce the maximum amount of stress without entering the region where an antibody or other therapeutic would begin to unfold because unfolding may induce degradation or stress that is not indicative of stability under normal storage conditions. Operationally this means that the DSC unit must exhibit excellent baseline stability to ensure that these initial unfolding events can be distinguished from baseline fluctuations.
Once the accelerated stability/preformulation phase of a project is complete, the formulation development activities such as syringeability and container closure compatibility are conducted to ensure that the proposed product formulation can be administered as intended and that there are no major compatibility problems with the container closure system.
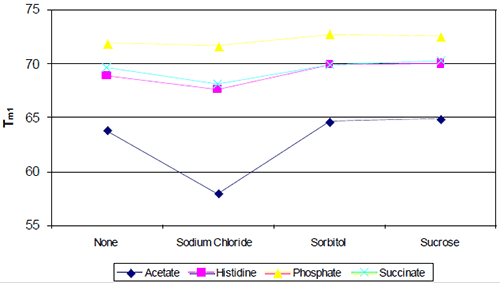
The following study was conducted to develop a high-concentration monoclonal using the general approach outlined above. Initial preformulation development began with a baseline biophysical study that evaluated the effect of buffer type/pH against a standard panel of excipients (Figure 5), each of which represents a particular class or type of excipient (ionic, polyol, disaccharide, etc.).
|
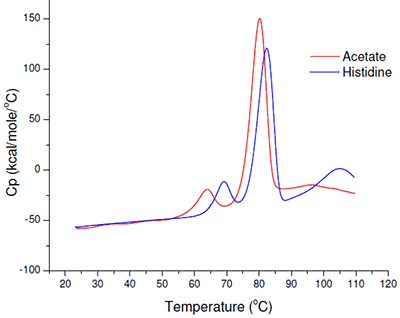
Even based on a simple rank-ordering approach, it was apparent that acetate did not appear to be a suitable buffer system. Although the effect of sodium chloride on the initial thermal transition was generally moderate, in the acetate buffer system there appeared to be an interaction which made the combination of acetate and sodium chloride poor from a thermal stability point of view. Example thermograms for the acetate and histidine buffer systems are shown in Figure 6.
|
Although phosphate-containing buffers appeared to show the best thermal stability, standard analytics conducted during accelerated stability indicated that the phosphate buffer system was not as suitable as formulations containing histidine.
Based on these data and on previous studies, a response surface design was constructed that was used to optimize the pH, buffer concentration and excipient concentration within a more narrow design space (Table 1).
| pH | Buffer Conc. (mM) | Excipient Conc. (mM) |
|---|---|---|
| 6 | 35 | 115 |
| 6 | 35 | 115 |
| 6.75 | 20 | 150 |
| 5 | 35 | 115 |
| 6.75 | 50 | 80 |
| 5.25 | 50 | 150 |
| 6 | 35 | 115 |
| 5.25 | 20 | 80 |
| 5.25 | 20 | 150 |
| 6.75 | 20 | 80 |
| 6 | 35 | 115 |
| 6 | 55 | 115 |
| 6 | 15 | 115 |
| 7 | 35 | 115 |
| 5.25 | 50 | 80 |
| 6 | 35 | 50 |
| 6 | 35 | 115 |
| 6.75 | 50 | 150 |
| 6 | 35 | 115 |
| 6 | 35 | 180 |
Since some of the lower temperature stress conditions from early studies did not show significant degradation, DSC data was used to target a temperature (50°C) that would offer the maximum chance of stressing the molecule without partially unfolding the antibody. DSC analysis was performed on all samples at time zero and for the center point formulations after four weeks accelerated stability. For all other analytical techniques, analysis was performed on control (4°C) and stressed (50°C) samples following a four-week incubation (Table 2).
| Test | Method | Time - 0 | Time - 4 weeks |
|---|---|---|---|
| Physico-Chemical | Differential Scanning
Calorimetry | X | |
| Viscosity | |||
| Appearance | X | X | |
| pH | X | X | |
| Purity | Peptide map (ESI-MS and UV) | X | |
| SDS - PAGE (reduced and non-reduced) | X | ||
| CEX-HPLC | X | ||
| SEC-HPLC | X | ||
| Strength | UV A280 | X | |
| Potency | ELISA | X |
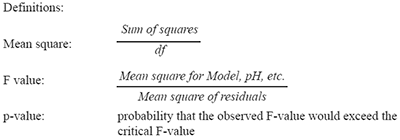
Although a variety of thermodynamic parameters can be determined using DSC, the analysis of the DSC data for the formulations in Table 1 was focused on the midpoints of the thermal transitions using Design-Expert (Stat-Ease, Minneapolis MN). Based on the model, each of the individual factors was found to be significant along with quadratic terms for each factor. Interestingly, no interaction terms were found to be significant with an alpha of 0.05 (Table 3). Diagnostic plots did not reveal any outliers or deviations from a normal distribution that would require a transformation.
| Source | Sum of squares | df | Mean square | F value | p-value Prob > F |
|---|---|---|---|---|---|
| Model | 246.0185 | 6 | 41.00309 | 1089.692 | < 0.0001 |
| A-pH | 236.2554 | 1 | 236.2554 | 6278.691 | < 0.0001 |
| B-Buffer conc. | 0.287701 | 1 | 0.287701 | 7.645901 | 0.0161 |
| C-Excipient Conc. | 0.695344 | 1 | 0.695344 | 18.47936 | 0.0009 |
| A2 | 8.286562 | 1 | 8.286562 | 220.2225 | < 0.0001 |
| B2 | 0.619167 | 1 | 0.619167 | 16.45491 | 0.0014 |
| C2 | 0.2832 | 1 | 0.2832 | 7.526291 | 0.0167 |
| Residual | 0.489166 | 13 | 0.037628 | ||
| Lack of Fit | 0.341832 | 8 | 0.042729 | 1.450081 | 0.3546 |
| Pure Error | 0.147333 | 5 | 0.029467 | ||
| Cor Total | 246.5077 | 19 |
|
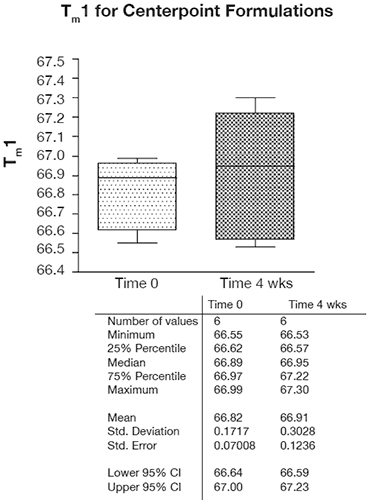
In the context of preformulation projects, capillary DSC has shown both the throughput and precision that enables the statistical analysis of fairly subtle trends and effects, as is shown by the excellent precision for six replicate center point formulations in Figure 7.
|
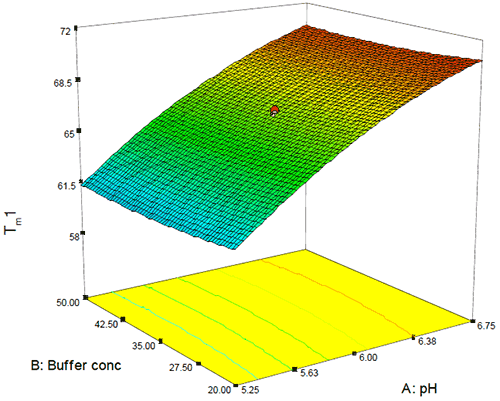
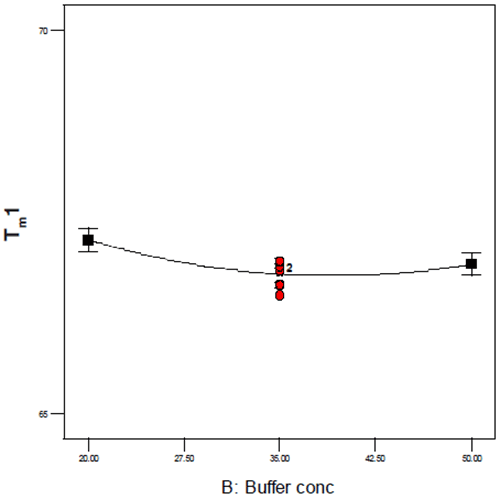
As this Figure shows, the typical precision ranged from 0.2 – 0.4% RSD and even over a temporal span of 4 weeks, the mean values for the first thermal transition were within 0.1°C. Examination of the DOE 3-D and one-factor plots also showed the effects of this precision because although pH, buffer concentration, and excipient concentration are shown to be statistically significant, the only factor that appears to have an appreciable slope or effect on Tm1 is pH as shown in Figure 8. By contrast, for buffer concentration (shown in Figure 9), the slope approaches zero, suggesting that although buffer (and excipient) concentration may be statistically significant, they are not likely to be operationally significant in terms of product stability.
|
|
While DSC is an important part of most preformulation studies, the ability to demonstrate protein stability relies not on one technique but rather on a series of biophysical and analytical methods to provide a more complete picture of protein stability. Other assays such as size exclusion, dynamic light scattering, ion exchange, and potency or activity assays are frequently employed to assess the effect of a particular factor on protein stability. While first order or screening designs typically show a reasonable correlation between thermal and other forms of stability, second-generation designs such as response surface designs often show differences between the various techniques and scientific staff must balance these assays as well as the proposed indication or means of administration in selecting the final formulation.
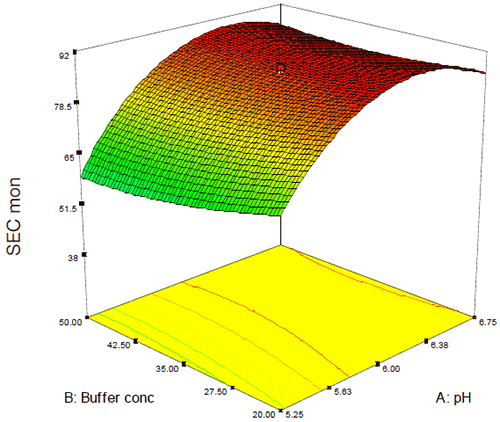
In this case, while DSC showed a general trend of increasing thermal stability as a function of pH (Figure 8), analysis of the percent monomer by SEC showed a saddle plot centered around pH 6.3 (Figure 10). The data from these and several other assays were combined in order to target several candidate formulations that showed suitable conformational and chemical stability. Several of these potential formulations, however, did not meet the criteria for isotonicity that would be required for a low-volume injectable drug product so the data were re-evaluated with respect to both buffer and excipient strength in order to create an isotonic formulation. As was observed for Figure 9, neither buffer nor excipient strength were observed to have a practical effect on product quality following accelerated stability which permitted the addition of a limited amount of excipient in order to create a stable, isotonic formulation for this antibody.
|
The approach outlined here represents a defined, rational approach to the formulation development of biotherapeutics. It relies heavily on quantitative, automated techniques such as MicroCal VP Capillary DSC where a large region of design space may be examined efficiently and with sufficient precision to allow for the identification and analysis of critical factors and their interactions. Excellent repeatability and intermediate precision of DSC fits well with factorial design and response surface design approaches as even factors that have fairly subtle effects on product stability can be identified and optimized.