
Analysis of pollen samples on the Morphologi G3 allows them to be automatically characterized in terms of both particle size and shape, aiding the distinction of different pollen types during the development and testing of immunotherapy or diagnostic products. The system helps to monitor the purity of the pollen samples through identification of foreign particles such as spores and undesirable pollen types.
Some of the most frequent inhalant allergens from the natural environment are present in pollen grains and a wide range of pollen source material is used in the production of immunotherapy or diagnostic products as well as in allergy research.
The clinical efficacy of allergy diagnostic products is highly dependent on the composition of the active allergen source material chosen. Therefore, it is highly important to effectively characterize source material during the manufacturing process. Traditionally, manual microscope methods have been employed for controlling the purity of the products and to identify foreign particles such as spores and foreign pollens.
The Morphologi® G3 automated particle characterization system is an analytical tool that provides microscope quality images and delivers statistically significant data through the rapid analysis. Thousands of particles are analyzed with little or no user intervention giving significant savings in time and labor compared to manual microscopy work.
The system can be used to analyze different types of pollen as will be described in this case study.
Three types of pollen were used for the study. Two of the samples were single species and the third contained a mixture of two species. The samples were:
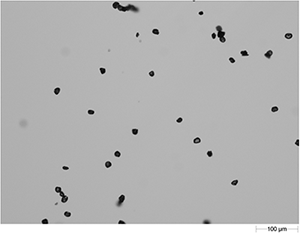
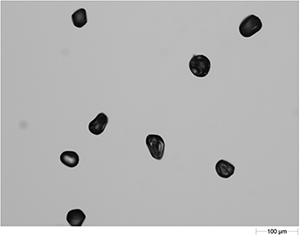
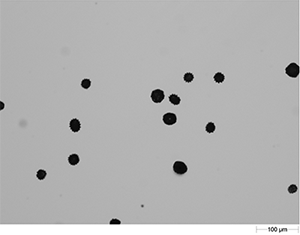
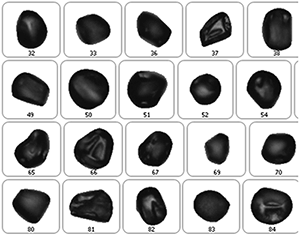
The 3 samples were dry dispersed using the Morphologi G3SE’s integrated Sample Dispersion Unit (SDU) and were measured using Standard Operating Procedures (SOPs) which define all of the instrument’s software and hardware settings. Filters were applied to all analyses to remove images with a low pixel area, thus limited shape information, and images of touching particles from the final results. Three repeat measurements were performed on each sample. Example field of view images of the threes different pollen samples taken using the Morphologi G3’s manual microscope facility can be seen in Figure 1.
|
|
|
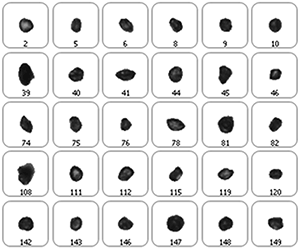
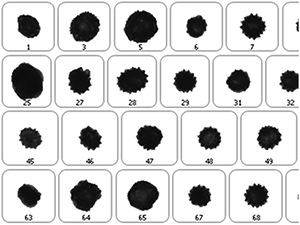
An image of every particle analyzed during the measurement is retained and example images for each of the pollen samples are shown in Figure 2.
|
|
|
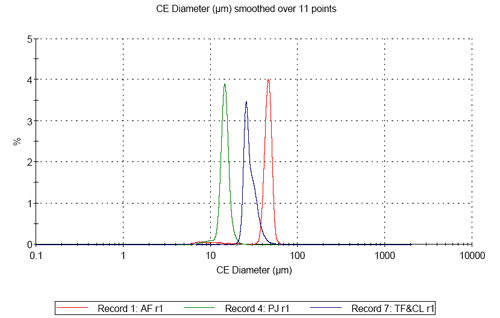
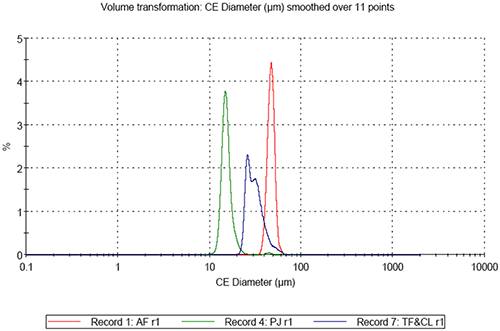
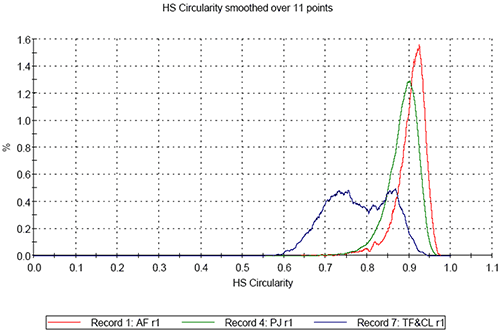
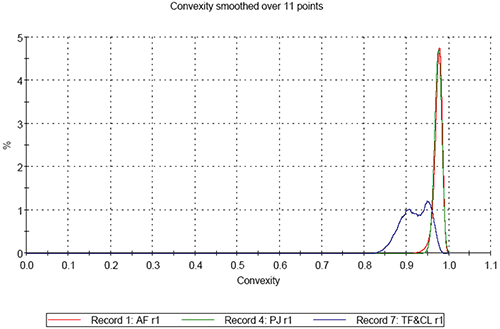
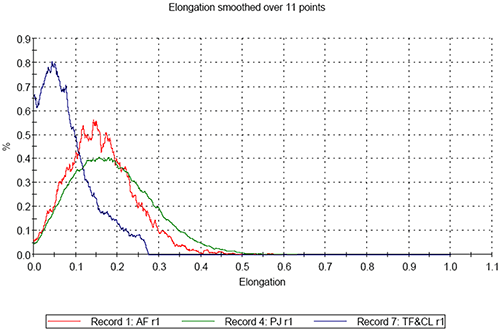
On comparing the results for the analyses of the three pollen samples, differences in both size and shape are apparent. Figure 3 shows the resulting size distributions for the first analysis of the three different pollen sample types in terms of Circular Equivalent (CE) diameter on a number basis (3a) and on a volume basis (3b). Figures 4 to 6 show the shape distributions for the same samples in terms of High Sensitivity (HS) Circularity (4), Convexity, a measure of surface roughness (5), and Elongation, a measure of overall form or how ‘needle-like’ the particles are (6).
|
|
|
|
|
It can clearly be seen that sample AF is the largest in terms of CE diameter and sample PJ is the smallest. The mixed sample is bi-modal in terms of CE diameter. Sample AF is found to be the most circular of the three samples and sample PJ is slightly less circular than sample AF. The mixed sample presents a much lower circularity than the first two and is bi-modal in terms in terms of the distribution. In terms of convexity samples PJ and AV are found to be very similar with high convexity thus relatively smooth edges, compared to the mixed sample which is much lower in terms of convexity indicating the particles have rougher edges.
Sample PJ shows the highest elongation, whist the mixed sample shows the lowest elongation. This indicates that the length of the particles in the mixed sample is more similar to their width than for the other samples.
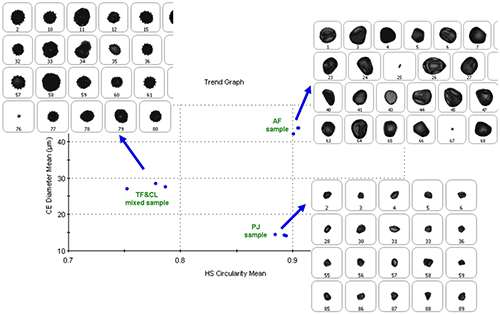
Figure 7 shows a scatter plot for the results of the three repeat measurements for each of the three samples. In this case the plot is of the mean CD diameter against the mean HS circularity. It can be seen that the 3 measurements for each sample type cluster together well. If an unknown sample was measured and its result added to the plot, its position on the plot with respect to the clusters could be a way to identify what type of pollen it was.
|
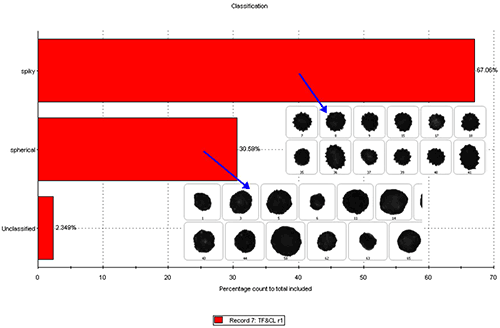
Post measurement classifications were applied to the mixed sample results to try to distinguish the proportions of the different types of particle in the samples. For the purposes of this analysis particle images were described as either Spiky or Spherical. Figure 8 shows the results of the classification for the first analysis in terms of the proportions of each type of particle found, along with example images of the ‘spiky’ and ‘spherical’ particles.
|
Analysis of pollen samples on the Morphologi G3 allows them to be automatically characterized in terms of both size and shape. Results aid the distinction of different types of pollen and, along with the particle images, allow samples to be checked that they only contained the desired types of pollen. Mixed samples can be further characterized to determine the proportion of each type of pollen present.