
The ability to quickly and reproducibly measure coffee ground particle size and size distributions is important during grinding operations to ensure that the coffee quality is maintained and that the correct grade is produced. The Mastersizer 3000 and the Funnel Sample Feeder for the Aero S dry powder disperser provides this capability, offering a rapid alternative to traditional sieve analysis.
The routine measurement of the particle size distribution of coffee samples produced during grinding operations is common practice in order to monitor the consistency of the coffee grind [1]. Traditionally, size measurements have been carried out using sieve analysis. Although this has provided a means of grind control, the measurements are complicated, time consuming and the resolution is often not high enough to detect the onset of drift within the grinding loop. In comparison laser diffraction is a well proven particle size measurement method which boasts the measurement range (0.01-3500mm), ease of use and quick measurement cycles required to support reproducible manufacture of coffee grind sizes associated with different coffee grades.
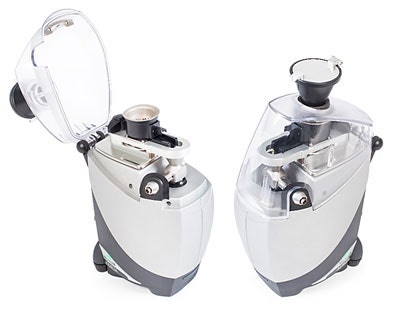
Figure 1: The Funnel Sample Feeder attached to an Aero S Dry Dispersion Unit
In this application note, we introduce the use of the Funnel Sample Feeder (FSF) for the Mastersizer 3000’s Aero S dry powder disperser. This provides the perfect platform to perform bulk measurements of coffee grounds as part of production and quality control by accurately, quickly and easily dispersing and measuring coffee samples ranging up to 130 ml in volume. The FSF consists of a sample feed hopper and funnel suited to accommodate particularly large sample volumes. In addition, the coatings used on the surfaces of the FSF are designed to minimize adhesion of sticky, oily samples, reducing the requirement for manual cleaning for the unit between measurements, a clear advantage over sieving techniques.
In the case study presented here, we measure aliquots of 5 to 6 g of both coarse and fine coffee using the FSF in order to determine whether the achieved measurement reproducibility meets the guidance provided in ISO13320 - the international standard for laser diffraction measurements [2]. The fine grade coffee was chosen for its cohesive nature whilst the coarser coffee was chosen as it represented a more free-flowing sample.
The fine grade coffee was tumbled and measured out into aliquots of 5 g. Due to its greater polydispersity, the coarser grade was tumbled and then split using a spinning riffler to provide reproducibly-sampled aliquots of sizes ranging between 5-6 grams.
The conditions required for sample dispersion were determined following the procedure described in ISO13320 [2, 3]. Each sample was found to be fully dispersed within the Aero S dry powder disperser using a dispersion pressure of 2 bar. The flow rate of the sample through the Aero S disperser was controlled to ensure that a realistic measurement concentration was obtained within the Mastersizer 3000 system and also to ensure reproducible dispersion. The versatility in the design of the FSF allows for the regulation of sample flow using its simple magnetic gates to adjust the flow gap within the hopper as well as using a specially designed mesh to aid capture and dispersion of very large or loose agglomerates. The optimum feed rate for the fine and coarse grades was determined to be 60% and 80% respectively.
Using the funnel on the FSF makes adding the sample to the Aero S dispersion unit simpler and easier, reducing the time to results. Fifteen aliquots of the fine measurements were made for both coffee grades, with the time between each measurement (including system initialization, sample measurement and cleaning) being approximately 2 minutes. The average particle size distributions obtained are reported in Figure 2, and the reproducibility of the analysis is confirmed in Table 1A and 1B.
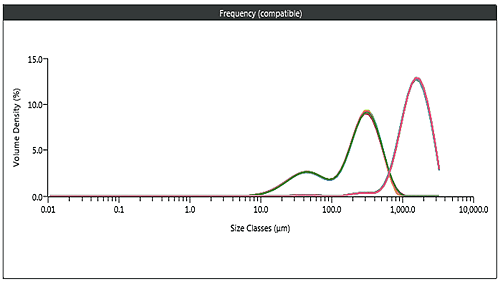
Figure 2: Result Overlay of the 15 measurements made for both coffee grades.
| A) | Record Number | Dv10 (µm)
ISO 5% RSD | Dv50 (µm)
ISO 3% RSD | Dv90 (µm)
ISO 5% RSD |
|---|---|---|---|---|
| 1 | 33.6 | 236 | 485 | |
| 2 | 33.3 | 237 | 495 | |
| 3 | 33.2 | 239 | 493 | |
| 4 | 33.3 | 238 | 495 | |
| 5 | 33.2 | 237 | 494 | |
| 6 | 33.5 | 236 | 495 | |
| 7 | 33.5 | 236 | 488 | |
| 8 | 33.8 | 236 | 496 | |
| 9 | 33.4 | 234 | 498 | |
| 10 | 33.5 | 236 | 495 | |
| 11 | 34.3 | 237 | 486 | |
| 12 | 34.6 | 239 | 499 | |
| 13 | 34.3 | 239 | 495 | |
| 14 | 34 | 236 | 490 | |
| 15 | 34.5 | 238 | 500 | |
| 1RSD (%) | 1.42 | 0.642 | 0.917 |
Table 1A: Variation, as measured by RSD, of 15 aliquots of fine grade coffee;
| B) | Record Number | Dv10 (µm)
ISO 5% RSD | Dv50 (µm)
ISO 3% RSD | Dv90 (µm)
ISO 5% RSD |
|---|---|---|---|---|
| 1 | 776 | 1490 | 2570 | |
| 2 | 766 | 1480 | 2550 | |
| 3 | 765 | 1470 | 2550 | |
| 4 | 774 | 1480 | 2550 | |
| 5 | 783 | 1500 | 2570 | |
| 6 | 778 | 1490 | 2560 | |
| 7 | 775 | 1490 | 2560 | |
| 8 | 782 | 1500 | 2570 | |
| 9 | 787 | 1510 | 2570 | |
| 10 | 778 | 1490 | 2570 | |
| 11 | 780 | 1490 | 2560 | |
| 12 | 787 | 1500 | 2570 | |
| 13 | 786 | 1500 | 2570 | |
| 14 | 792 | 1500 | 2570 | |
| 15 | 792 | 1500 | 2570 | |
| 1RSD (%) | 1.05 | 0.665 | 0.305 |
Table 1B: Variation of 15 aliquots of coarse grade coffee
The results confirm that the Mastersizer 3000 is able to easily resolve the differences between each coffee grade. In addition, the data in Table 1 clearly shows that the reproducibility of analysis the FSF can deliver is excellent, being well within the limits suggested by ISO13320 (this suggests a measurement repeatability of 3% for the Dv50 and 5% for the Dv10 and Dv90). Furthermore, no adhesion of the finer coffee to the sample flow path was observed, enabling a rapid sample turn-around.
Control of the particle size distribution of coffee grounds is important during grinding operations in order to control the consistency of the final product. The Funnel Sample Feeder for the Mastersizer 3000’s Aero S dry powder disperser supports this requirement, providing a means for rapid, reproducible measurements of bulk coffee samples as part of process and quality control. The sample through-put and ease of use of the system makes it an ideal replacement for traditional sieving techniques.
Malvern Panalytical application note AN121220: Measuring the particle size distribution of coffee grounds using laser diffraction.
ISO13320 (2009). Particle Size Analysis - Laser Diffraction Methods, Part 1: General Principles
Malvern Panalytical technical note TN130222: Dry powder method development for laser diffraction particle size Measurements.
| Evaluation Criteria | Laser Diffraction | Sieve Analysis |
|---|---|---|
System Preparation | Connect the dispersion unit to the bench and make sure all devices are powered up | Clean individual sieves
|
Method Development | Several test runs of any sample size | Optimize vibration and sieving time |
Measurement Cycle | Feed in sample material
| Weigh each empty sieve.
|
Result Processing | Click on desired record and view results in user-defined reports. | Empty and weigh each individual sieve
|
Ease of Use | Open lid, load sample in and run measurement with automated clean | Manually empty, weigh and wash each sieve |
Typical measurement time | 1 min to results.
| At least 5 minutes for measurement, dependent on the size distribution width.
|
Dynamic Range | 10 nm – 3.5 mm | Sieve dependent |