This application note discusses the use of non-invasive backscatter dynamic light scattering for the measurement of globule size distributions in lipid injectable emulsions, specifically Intralipid®.
Lipid injectable emulsions are used as an energy source and for the delivery of nutrients into patients who cannot take food normally. When mixed with other essential components such as amino acids, vitamins and minerals they form total parental nutrition (TPN) mixtures.
The size of the emulsion droplets is one of the most important parameters as there is a direct relationship between the size and toxicity. Large globule sizes and polydisperse size distributions have been shown to reduce coronary blood flow [1].
Lipid injectable emulsions are typically formulated at high concentrations and therefore there are few characterisation techniques available that can measure the sample in its native state. Dilution of concentrated emulsion systems can cause changes in the reported size [2]. It would be an advantage therefore to be able to determine the size distribution of lipid injectable emulsions at or close to their original concentration.
This application note discusses the use of non-invasive backscatter dynamic light scattering for the measurement of globule size distributions in lipid injectable emulsions, specifically Intralipid®.
Dynamic light scattering (DLS) is a non-invasive technique suitable for the size characterization of nanoparticles and low-molecular weight molecules such as proteins and polymers [3-5]. The technique measures the time-dependent fluctuations in the intensity of scattered light that occur due to the random movement of the particles or molecules undergoing Brownian motion. The velocity of this Brownian motion is measured and is called the translational diffusion coefficient (D) which can be converted into a hydrodynamic diameter (DH) using the Stokes-Einstein equation [3-5].
DLS detection in the back scatter region has been adopted as the preferred measurement angle across multiple vendors however, only Malvern takes full advantage of the benefits available. The Malvern patented NIBS technology allows for the largest range of sample concentrations to be measured, providing consistent results from very high concentration to very low – a unique and powerful technique. The Zetasizer Nano utilizes NIBS technology, combining backscatter detection with variable measurement position and high efficiency fiber optic technology.
The measurement position within the cuvette is changed by moving a focusing lens as shown in figure 1. For small particles or samples at low concentrations, it is beneficial to maximize the detection volume within the sample to provide the optimal signal-to-noise. Utilizing backscatter detection in the center of the cell increases the measurement volume eight-fold over the equivalent 90-degree system. The opposite position is desired when analyzing large particles or samples at high concentrations, as these scatter much more light. In this situation, measuring closer to the cuvette wall will reduce the effect of multiple scattering by minimizing the path length over which the scattered light has to pass, figure 1b. For small particles, measuring at the cell wall not only reduces the signal-to-noise, but as the laser passes through the wall of the cuvette and into the dispersant, the laser will “flare”. This flare may swamp the scattering signal. Moving the measurement point away from the cuvette wall towards the center of the cuvette will remove this effect, figure 1a. Therefore, the ideal ability is to be able to fine adjust the measurement position, which the Zetasizer Nano does automatically, determining the optimal position through a combination of the intercept of the correlation function and the intensity of the scattered light detected. This capability means the Nano will be able to select one of the many positions available to it to ensure the DLS experiment is performing according to the scientific principles, helping to ensure the correct answer is achieved, every time. As it does this using the same detection angle, the answer will be repeatable across the concentration range, even with polydisperse samples or large particles which will give different results dependent on whether 90° or backscatter is used.
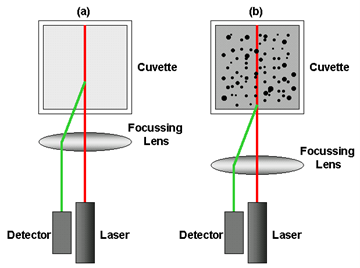
Figure 1: Schematic diagram showing the measurement position for (a) small, weakly scattering samples and for (b) concentrated, opaque samples. The measurement position is achieved by moving the focusing lens accordingly.
The U.S. Pharmacopeia Convention (USP) <729> document [6] describes two methods for determining the mean droplet size and size distribution of injectable, oil-in-water, parenteral nutrition emulsions:
Method I is of interest for Malvern Zetasizer users. Even though there are some minor variations to the procedure stated in the USP method, these still fall within the definition and allowances of the USP guidance. Specifically, these variations are;
Intralipid® was purchased from Sigma-Aldrich (cat. no. I141) at 20% w/v concentration. Various dilutions of the emulsion were made with deionized water and these were measured on a Zetasizer Nano ZSP using a detection angle of 173o. All measurements in this study were taken at a temperature of 25oC with three repeat measurements on each sample taken to check for result repeatability using disposable sizing cuvettes. The Nano ZSP uses a 10mW He-Ne laser operating at a wavelength of 633 nm. The z-average diameters and polydispersity index values were determined from the cumulants analysis as defined in ISO13321 [4] and ISO22412 [5].
The Zetasizer Nano ZSP incorporates NIBS optics that allows for the measurement of both concentrated, turbid samples and low concentration, weakly scattering samples as discussed above. Table 1 summarises the results obtained from three repeat measurements for a wide range of Intralipid® concentrations. The table includes the sample concentrations, the z-average diameters (in nanometres) with standard deviations, the polydispersity index values with standard deviations and the measurement positions automatically determined by the software.
The measurement position is automatically calculated from a combination of the intercept of the correlation function and the intensity of the scattered light detected. The measurement position is referenced to the outer wall of the measurement cuvette (defined as 0 mm). When the sample concentration is low, the influence of multiple scattering is negligible and therefore the measurement position automatically selected is the center of the cell (4.65 mm). However, an increase in the sample concentration results in an increase in multiple scattering. Therefore, the measurement position automatically selected is closer to the wall thereby reducing the path length and hence the probability of multiple scattering. The results obtained show the gradual change from the optical center of the cell (4.65 mm) to the wall (0.65 mm) across the sample concentration range studied.
In addition to the measurement position being automatically selected, the amount of scattered light being detected is controlled through a series of attenuators. When the concentration of the sample is high, the laser beam is heavily attenuated to ensure that an optimal count rate is detected. With the gradual decrease in sample concentration, the attenuation of the laser is reduced to maintain this optimum level of scattered light.
The z-average diameters obtained show excellent consistency across a wide sample concentration range. Across five decades of sample concentration (5% to 0.0001%), the average size is calculated to be 289.4nm with a standard deviation of 3.9nm. Such consistent size information confirms the ability of NIBS DLS to be able to correctly measure the size of a sample across a wide concentration range. This eliminates the requirement to significantly dilute the sample for successful measurements to be made. In addition, the ability to measure the size of samples at or close to their original concentration minimises concerns about changes in the sample morphology.
| Sample Concentration (% w/v) | z-Average Diameter /nm (SD) | Polydispersity Index (SD) | Measurement Position (mm) |
|---|---|---|---|
| 5 | 288 (2.7) | 0.199 (0.17) | 0.65 |
| 2.5 | 287 (1.3) | 0.182 (0.01) | 0.65 |
| 1 | 285 (4.0) | 0.159 (0.04) | 0.65 |
| 0.1 | 290 (1.6) | 0.137 (0.03) | 1.25 |
| 0.01 | 288 (3.0) | 0.140 (0.23) | 4.65 |
| 0.001 | 292 (4.0) | 0.149 (0.01) | 4.65 |
| 0.0001 | 296 (10.9) | 0.240 (0.07) | 4.65 |
Table 1: Summary of the NIBS-DLS results obtained for various concentrations of Intralipid®. The table includes the sample concentrations, the z-average diameters (in nanometres) with standard deviations, the polydispersity index values with standard deviations and the measurement positions.
Figure 2 is a plot of the z-average diameters and polydispersity index values obtained as a function of the sample concentration.
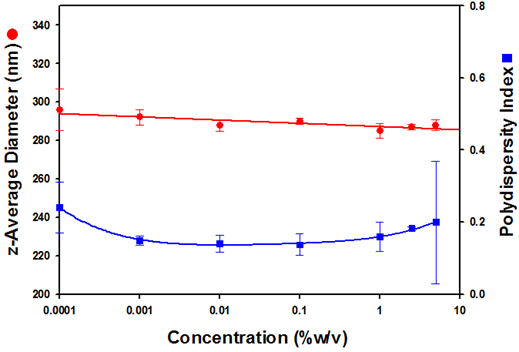
Figure 2: A plot of the z-average diameters (in nanometres) and polydispersity index values as a function of Intralipid® concentrations (%w/v).
The NIBS optical configuration contained in the Zetasizer Nano series is a unique combination of back scatter detection, variable measurement position and fiber optic technology. This allows DLS sizing measurements to be performed on samples of a wide range of concentrations and sizes as highlighted in this application note.
The Zetasizer Nano can be used to measure the globule size in lipid injectable emulsions at or close to their original concentration and adheres to USP<729>.
[1] D.J. Hearse, C. Erol, L.A. Robinson, M.P. Maxwell and M.V. Braimbridge (1985) J. Thorac. Cardiovasc. Surg. 89, 428-438.
[2] T.L Whateley, G. Steele, J. Urwin and G.A. Smail (1984) J. Clin. Hosp. Pharm. 9, 113-126.
[3] R. Pecora (1985) Dynamic Light Scattering: Applications of Photon Correlation Spectroscopy. Plenum Press, New York.
[4] International Standard ISO13321 (1996) Methods for Determination of Particle Size Distribution Part 8: Photon Correlation Spectroscopy. International Organization for Standardization (ISO).
[5] International Standard ISO22412 (2008) Particle Size Analysis: Dynamic Light Scattering (DLS). International Organization for Standardization (ISO).
[6] United States Pharmacopeia website http://www.usp.org/