
Whilst being able to measure particles of below 1 nm size, DLS is preferentially sensitive to larger particles due to the 6th power relationship between particle radius and scattering intensity. This means that sample preparation typically needs to be scrupulous, especially for low scattering samples such a proteins and biological molecules. The contribution to contaminants such as dust and aggregates can be mitigated by filtering, however this may not always be practical or possible depending on the volume and fragility of the sample. Filtration of samples can also constitute a financial burden, both in terms of additional sample preparation time and consumables costs. This application note introduces a new DLS data capture process called Adaptive Correlation which helps address these issues. Adaptive Correlation uses a statistically driven approach to produce the best correlation data, which in turn gives more reliable DLS size data. It can reduce the need for filtering and give added confidence in you DLS results.
Whilst being able to measure particles of below 1 nm size, DLS is preferentially sensitive to larger particles due to the 6th power relationship between particle radius and scattering intensity.
This means that sample preparation typically needs to be scrupulous, especially for low scattering samples such a proteins and biological molecules. The contribution to contaminants such as dust and aggregates can be mitigated by filtering, however this may not always be practical or possible depending on the volume and fragility of the sample. Filtration of samples can also constitute a financial burden, both in terms of additional sample preparation time and consumables costs. A new DLS data capture process has been developed called Adaptive Correlation, which uses a statistically driven approach to produce the best correlation data, which in turn gives more reliable DLS size data, which, as we will see, can reduce the need for filtering and give added confidence in DLS results.
The algorithm is applicable to all samples suitable for measurement by DLS, although to demonstrate the approach, we will discuss measurements of Hen’s egg lysozyme which provides a challenging case as a sample which is small, low scattering and tends to aggregate.
Adaptive Correlation (AC) is a new approach for capturing and processing DLS data which aims to produce the most reliable correlation function for accurate determination of the diffusion coefficient and particle size.
As well as using statistics to capture the optimum amount of data in as short a time as possible, AC also uses statistical models to highlight any captured data that is not representative of the sample, such as that due to a rare dust particle transiting the detection volume of the measurement.
AC is not however a size filter, and will not discriminate genuinely multimodal samples, but allows the characterization of consistent or steady state size components without data being skewed by intermittent or transient scatters. This approach means that not only has the tolerance to dust been improved, but measurements are quicker and repeatability improved, even for clean and stable samples.
As well as the statistical approach to identifying transient scattering events, the process for AC measurements has changed. Traditionally correlation data would be recorded for as long as possible to suppress and average out any source of noise and perturbation. With AC we perform many short sub-runs and average the resultant correlation functions to achieve this goal. This ultimately increases measurement repeatability compared with measurements performed over the same duration but using longer sub-runs.


Figure 1: Intensity weighted particle size distributions for a 1 mg/ml dispersion of lysozyme. Top and bottom figures show repeat measurements of the same aliquot of sample performed with and without AC respectively
Within the new process data quality is assessed during the measurement, and additional data is only recorded if it will improve confidence in the final reported size data. This process means that the measurement time can be up to three times faster than alternative correlation methods.
Figure 1 shows particle size distributions for repeat measurements of the same sample of lysozyme, measured with and without AC. The measurements performed without AC show that the main particle size distribution is poorly defined and varies in position between repeat measurements, whereas the adaptive correlation result is repeatable without the presence of apparent large sized material. Without AC it would be difficult to estimate the monomer size, and repeat sample preparation and measurement would likely be needed.
Due to the sensitivity of DLS to large material, it is recommended to filter dispersants and in some cases even the sample, with filters with a smaller pore size obviously providing the best filtering. This however can make sample preparation difficult and constitutes a financial burden with 20 nm syringe filters costing around $10 each.
For a protein sample, we may also need to filter the sample after dispersing the dry protein in order to measure a monomodal dispersion, as the lysozyme may not fully disperse, and the use of excessive dispersal energy can lead to the formation of aggregates. With an expected hydrodynamic size of 3.8 nm, a 20 nm filter will be our best candidate filter. Figure 2 shows particle size distributions for aliquots filtered using filters of 100 nm and 20 nm pore size, with data captured using the new AC algorithm and an alternative ‘dust rejection’ algorithm.
This data shows that whilst monomodal peaks with a consistent mean position can be produced using a 20 nm filter and the alternative algorithm, adaptive correlation produces better resolved and repeatable results from the same sample but filtered using a 100 nm filter. The sample aliquot filtered to 100 nm measured using the alternative dust rejection algorithm shows size peaks appearing over a range of positions, and both measurements using the alternative algorithm show small components at sizes over 1 µm, which are likely to be noise artefacts in this instance.

Figure 2: Intensity weighted particle size distributions for samples of 1mg/ml of lysozyme dispersed in a pH4.0 Acetate buffer, filtered after dispersion using syringe filters of a different pore size and captured using different measurement processes
Whilst it does not represent a typical sample preparation technique, we can also demonstrate the improved tolerance to aggregated material by mixing filtered and unfiltered samples and therefore varying the proportion of aggregates present in the sample.
The data in Figure 3 was produced by first measuring an unfiltered dispersion of lysozyme, which was agitated by excessive mixing during dispersion, and then preparing aliquots that were partially filtered using a 20 nm filter. Each aliquot was then measured 5 times using the Zetasizer Nano ZSP, which employs a different ‘dust rejection’ algorithm and the Zetasizer Ultra with AC.
Both sets of measurements for the unfiltered case report a high ZAve, indicative of significant presence of aggregated material, however the results gathered using AC show better repeatability.
AC is able to report a reliable and repeatable ZAve with minimum filtering, whereas a 16-fold reduction in the proportion of aggregates was needed for the alternative algorithm to report an aggreeable particle size.
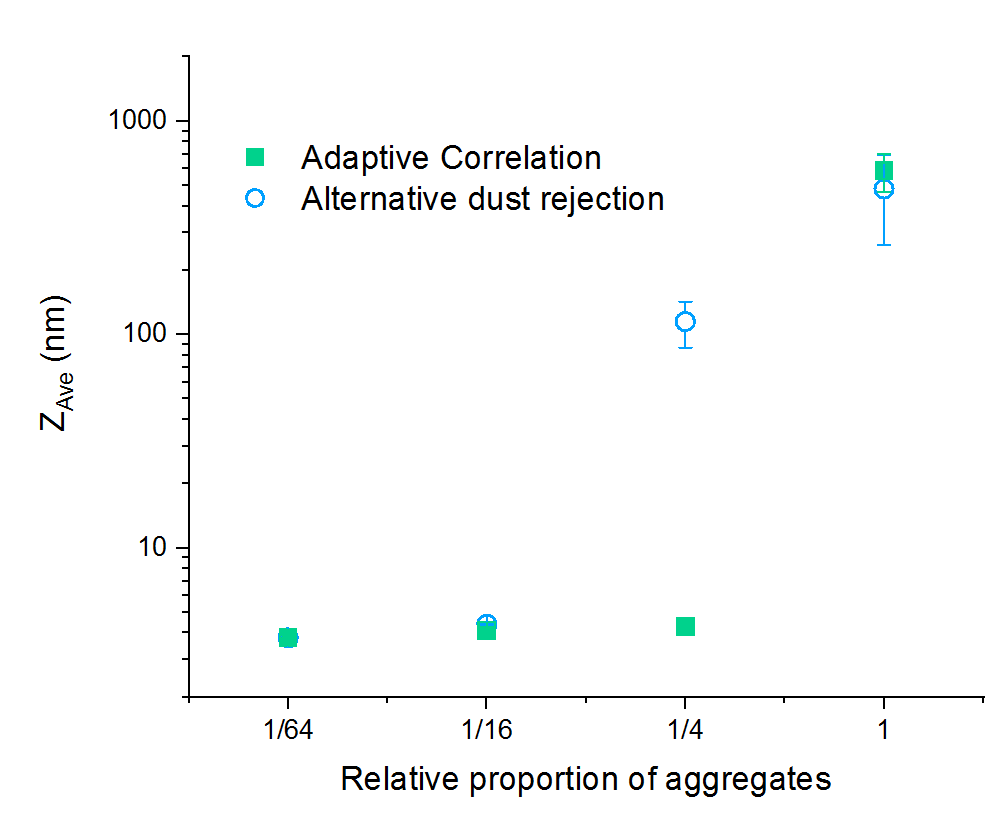
Figure 3: ZAve particle size reported for samples of lysozyme, filtered by different proportions measured using an alternative dust rejection algorithm and AC. The proportion of 1 shown on the x axis represent an aggregated and unfiltered sample. The data points represent the mean value from 5 repeat measurements, with standard deviations shown as error bars
By using statistical analysis and optimized data collection, Adaptive Correlation provides an improvement in the repeatability of DLS particle size measurements and the ability to measure primary particle sizes separately to the characterization of rare amounts of aggregated material. These improvements mean that faster, higher precision measurements may be achieved with less need for filtering of samples and dispersants, meaning that simplified sample preparation procedures may be used and with potential to reduce incurred costs for lab consumables.