Dynamic Light Scattering (DLS) allows the hydrodynamic size of particles in dispersion to be measured by quantifying their diffusive motion. At particle sizes approaching the upper size range for DLS, sedimentation, thermal currents and number fluctuations can mean that the detected scattering no longer accurately describes purely diffusive motion, and particle size analysis becomes less accurate.
This can be seen in measurements of monodispersed samples that exhibit artefacts in the correlation function baseline, Figure 1. This may be mitigated by adjusting dispersant, either density or viscosity, however both offer a less than ideal remedy as we are no longer measuring the original system of interest.
Here we will discuss how the Low Volume Disposable Sizing Cell can improve data quality at large particle sizes and allow the entire size range of DLS to be explored without modification of the dispersant system.
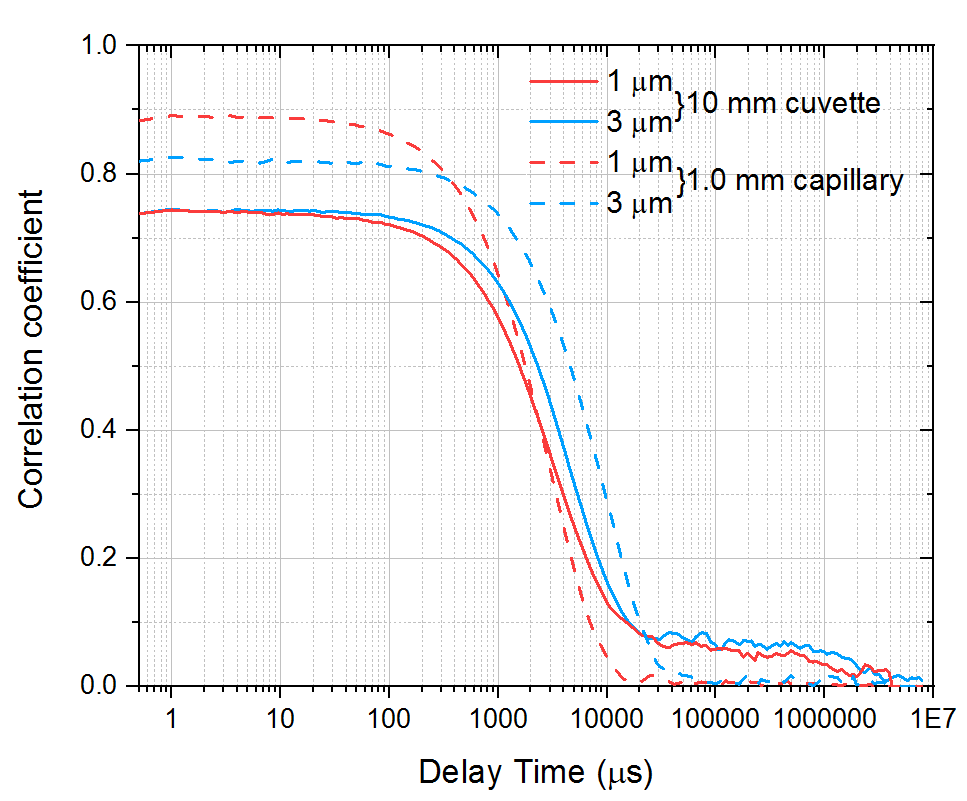
Figure 1: Example auto-correlation data from 1.0 µm and 3.0 µm latex in water. Measurements from both a 1.0 mm capillary and a 10.0 mm cuvette are shown. Despite these samples being mono-disperse, results for these particles in the 10 mm cuvette show an additional mode of decay in the measured auto-correlation function.
As particle size increases, thermal Brownian motion is no longer sufficient to keep particles in suspension, and samples may sediment over time, meaning that the motion of the particles is no longer random.
We can however rule out sedimentation as the dominant factor in the skewing of reported particle size at higher sizes by considering the time for particles to transit the incident laser beam during a DLS measurement. Figure 2 below shows that the times scales associated with sedimentation are much greater than the correlation times used to capture data in a typical DLS measurement, even when considering differences in material density.
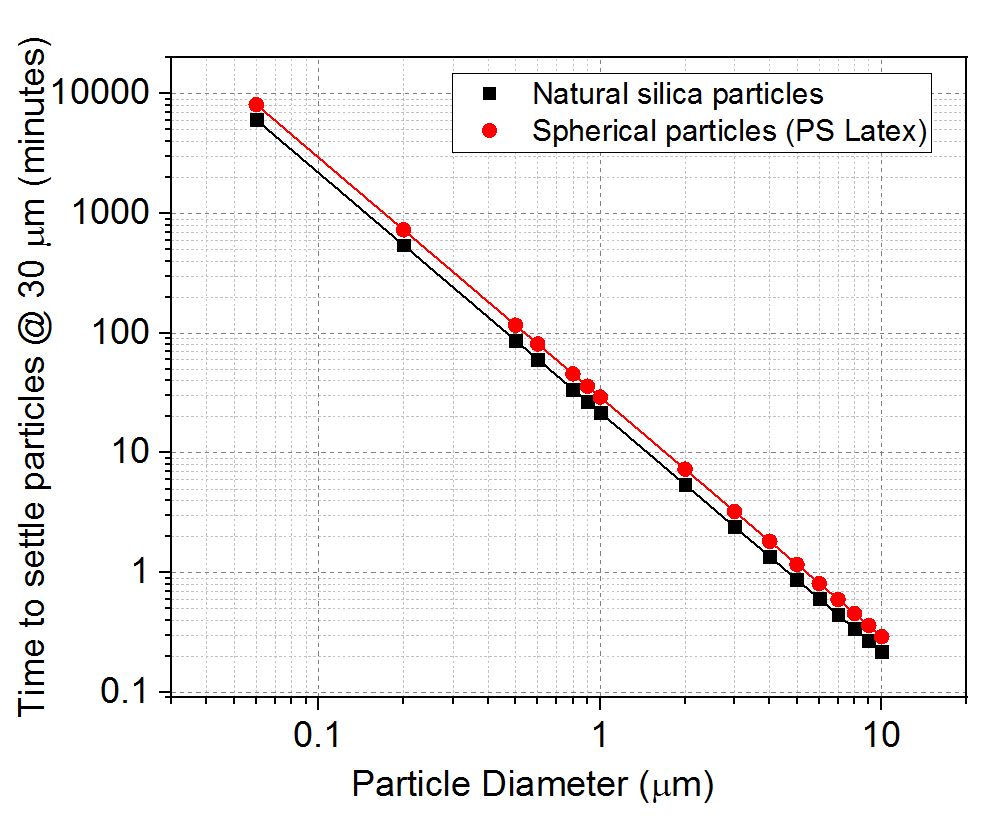
Figure 2: Calculated settling time as a function of particle size for polystyrene latex (ρ = 1050 kg/m3) and silica (ρ = 2650 kg/m3) particles dispersed in water at 25oC (η = 89 x 10-3 Pa s).
Measurements of particles over 1 micron in size may show some difference in variability as a function of temperature, suggesting that thermal effects may influence the artefacts seen in the measured correlation functions. Thermal modelling of a 10mm cuvette, with temperature controlled by contact with the cell holder of the instrument, shows that the geometry of the cuvette supports the formation of convection currents, Figure 3. Modelling of a capillary however, with a similarly controlled temperature shows that convection currents are not supported due to the constrains imposed by the narrow cross section.
This modelling does not look at the impact of particle size on the significance of these convection effects, however if we consider the rate of diffusion as a function of particle size, smaller particles diffuse more rapidly and thus the diffusive motion of the particles is the dominant transport property. At larger particle sizes, diffusion is slower and the increased cross section of the particles mean that they are more readily influenced by these additional currents.
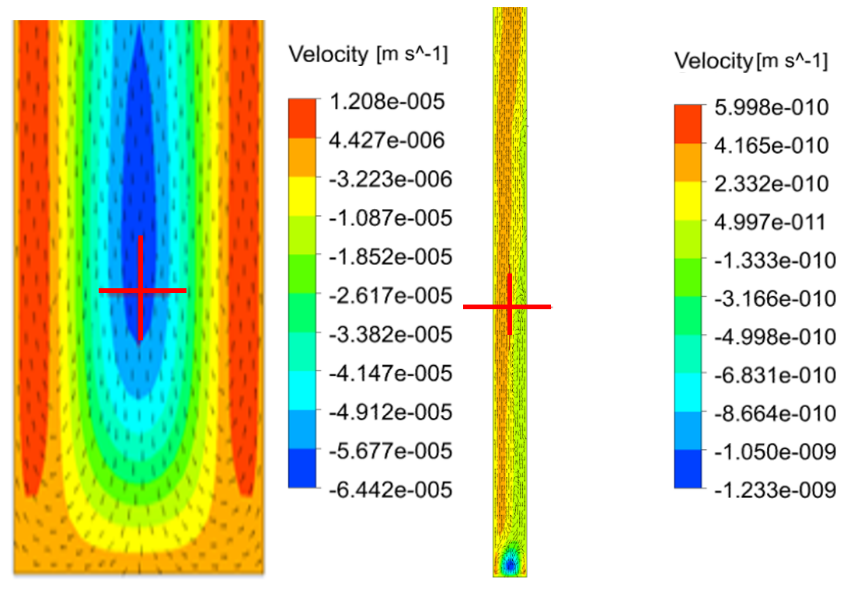
Figure 3: Thermal models of a 10 mm cuvette and a 1 mm capillary, calculated using ANSYS. The thermally driven velocity gradients shown represent the steady state condition after 120s of equilibration with a Peltier device at the bottom of each image controlling the system. The red cross-hair indicates the position of the detection volume where the DLS measurements are performed.
To demonstrate the improvement of measurement accuracy at larger particle sizes facilitated by the capillary, a series of differently sizes polystyrene latex particles were prepared in a 10mM NaCl solution and measured in both the low volume disposable sizing cell and a standard 10 mm cuvette. Mean and standard deviation particle size is shown in Figure 4, showing that without modification of the dispersant, the measurements performed in a cuvette were reported outside of their specified range at around 1 μm, whereas measurements in the capillary were reliable and accurate up to 10 μm.
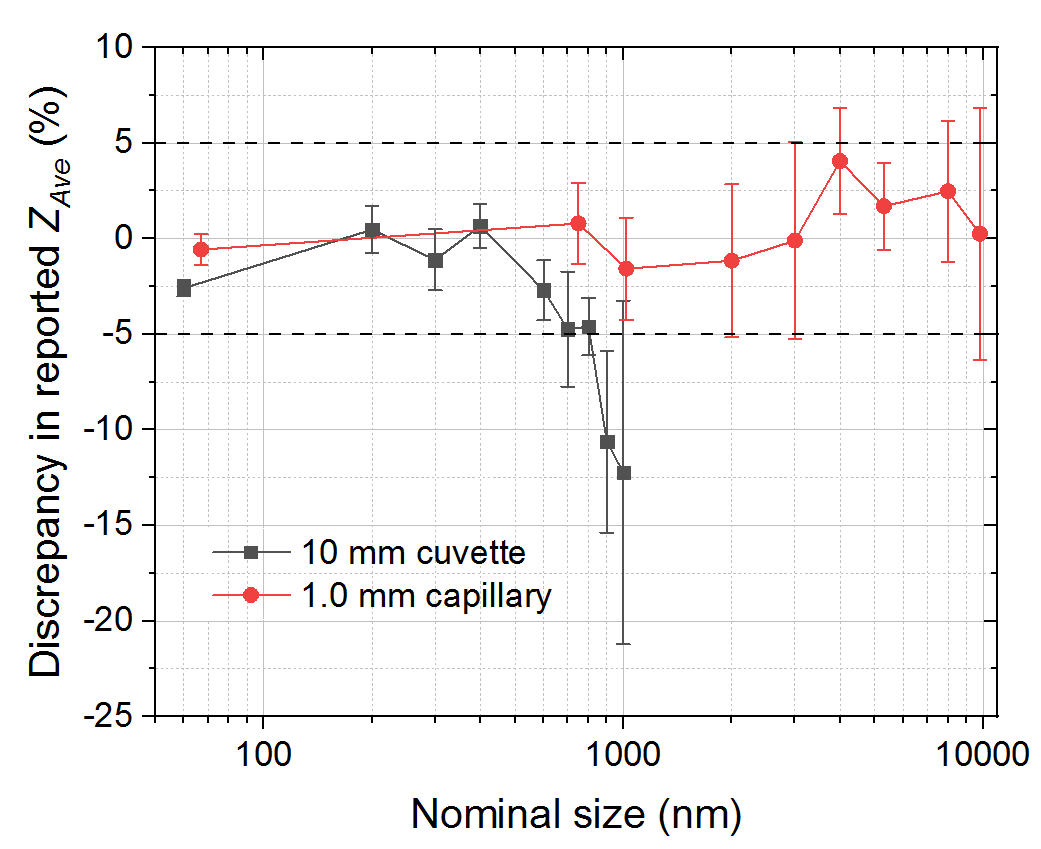
Figure 4: Discrepancy in the measured particle size, derived from cumulants analysis, and associated error, compared to the specified nominal size of a range of NIST traceable polystyrene latex particles, measured in both a 10 mm cuvette and 1 mm capillary.
As a demonstration of improved measurements at extended size range with a polydisperse sample, an arbitrary sample of UK soil was dispersed in filtered ultra-pure water and measured both in a 10 mm cuvette and the low volume disposable sizing cell. The characterization of soil is critical to the understanding the incursion of nano- and micro-particles in the environment, however the error bars for the cuvette-based measurements in Figure 5 would suggest that DLS is not a suitable technique in this case. The same measurements performed with sample loaded into a capillary, however, show much better resolution and improved repeatability as denoted by the narrower error bars, despite the sample being polydisperse in size from around 100 nm to over 1 μm.
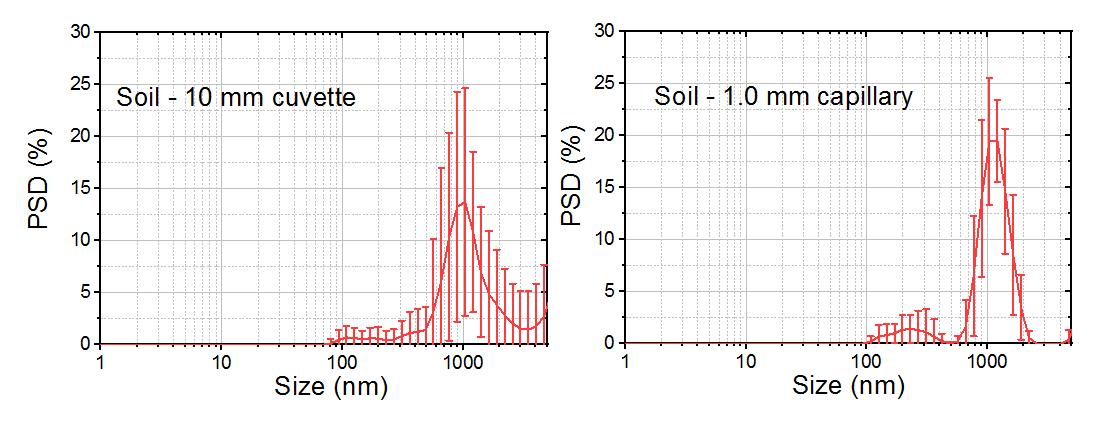
Figure 5: Intensity weighted particle size distributions for a polydisperse sample of soil, measured both in a 10 mm cuvette (left), and a 1 mm capillary. The distribution represents the average of 10 measurements and corresponding standard deviations. The measurements in the capillary show better repeatability shown by the narrower error bars, and a better resolved result.
We have shown that at the upper measurable size range of dynamic light scattering, thermal currents are the dominating phenomena that lead to artefacts in the correlation function and therefore deterioration in measurement accuracy. The geometry of the 1mm capillary used in the low volume disposable sizing cell does not support the formation of these convection currents and thus accurate measurements can be performed without modification of the sample dispersant over the entire measurable size range for DLS, and repeatability for polydisperse samples is improved over comparable measurements in a standard cuvette.
