Recycling metal powders is critical to realising the cost benefits of additive layer manufacture of metal parts. This application note presents the technique of Automated Static Image Analysis of particles and why that’s important in the formation of the powder bed.
Additive layer manufacturing refers to the 3D printing process that can produce complex shapes from comparatively small amounts of raw material. For metal parts, the traditional method is subtractive manufacturing whereby a part is machined from a solid block of metal in a milling process. But, why is there so much interest in the additive technique?
Login or create an account to read the full application note.
Additive layer manufacturing refers to the 3D printing process that can produce complex shapes from comparatively small amounts of raw material. For metal parts, the traditional method is subtractive manufacturing whereby a part is machined from a solid block of metal in a milling process. But, why is there so much interest in the additive technique?
It is of little surprise then to see a strong annual growth rate of 22.5% predicted for the next four years, reaching an estimated value of $36 billion in 2024 [1].
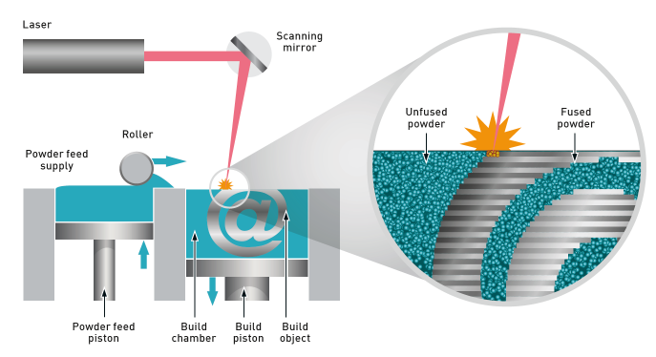
Figure 1. The powder bed process for additive layer manufacture
However, there are some technical challenges that are creating headwinds. One of which relates to the quality of the metal powder used in powder bed processes such as Selective Laser Melting (SLM). Figure 1 shows how a bed of powdered metal is formed and a scanning laser melts a 2D layer of a shape in the SLM process. A new powder bed is formed for each successive layer to build a 3D metal object.
The structural integrity of the metal object and the smoothness of the finish is related to the chemical properties of the powder and its packing density [2]. Figure 2 shows a simulation of the melt pool in the powder bed where the laser makes contact [3]. The melting temperature is related to the elemental composition of the powder and the continuity of the pool is controlled by packing density. The top simulation shows a low packing density bed leading to discontinuities. In this case, the finished part would have a rough surface and possibly a reduction in structural integrity. Whereas the high packing density bed shows a continuous melt pool, which would lead to a smoother finish and a stronger structure.
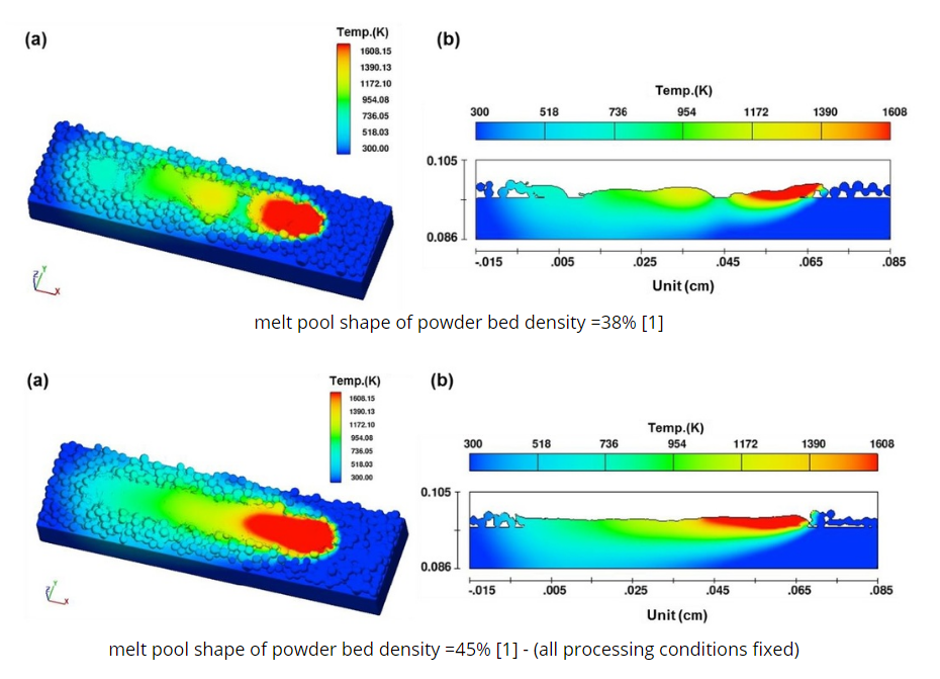 Figure 2. Melt pool analysis and the effect of packing density[3]
The packing density of powders is controlled by particle size and shape. Figure 3 illustrates that monomodal distributions have lower packing density when compared to multimodal distributions [4]. It also shows that packing density is maximized where the interstitial spaces are occupied by finer material.
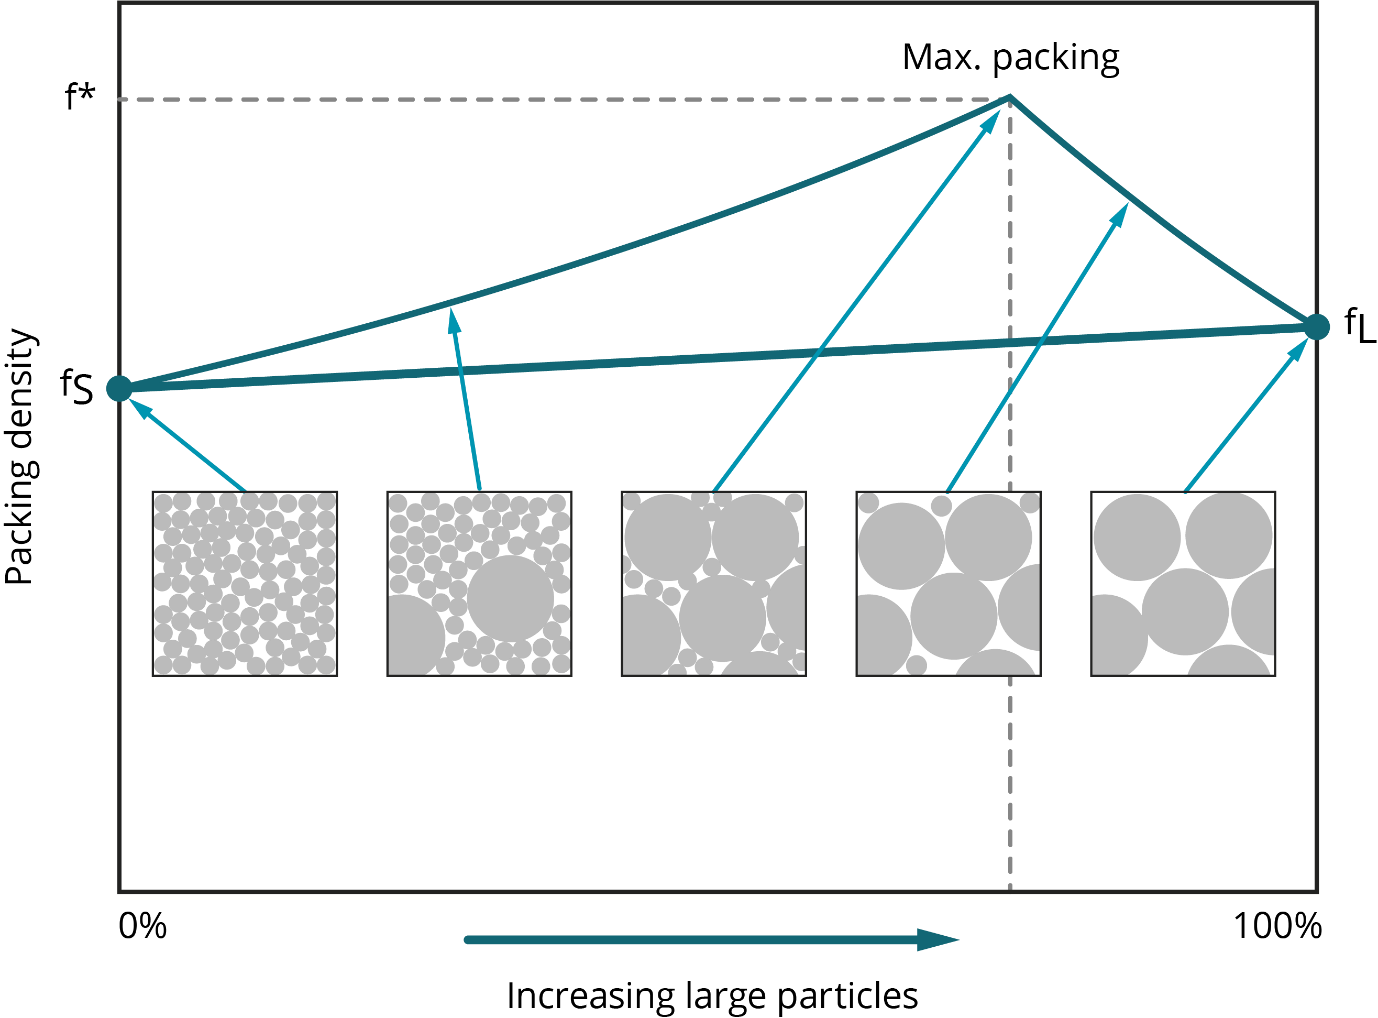
Figure 3. Particle size distribution versus packing density
However, the finer material is more cohesive because of a high surface area to bulk ratio [5]. This has a detrimental effect on the flowability of the powder and if the powder cannot flow, then it cannot form a homogeneous and high packed bed. Hence a high flowability of the powder is also desirable.
Similarly, particle shape also has an impact on both packing density and flowability whereby irregular shapes and surface friction can cause these properties to reduce (Figure 4) [6].
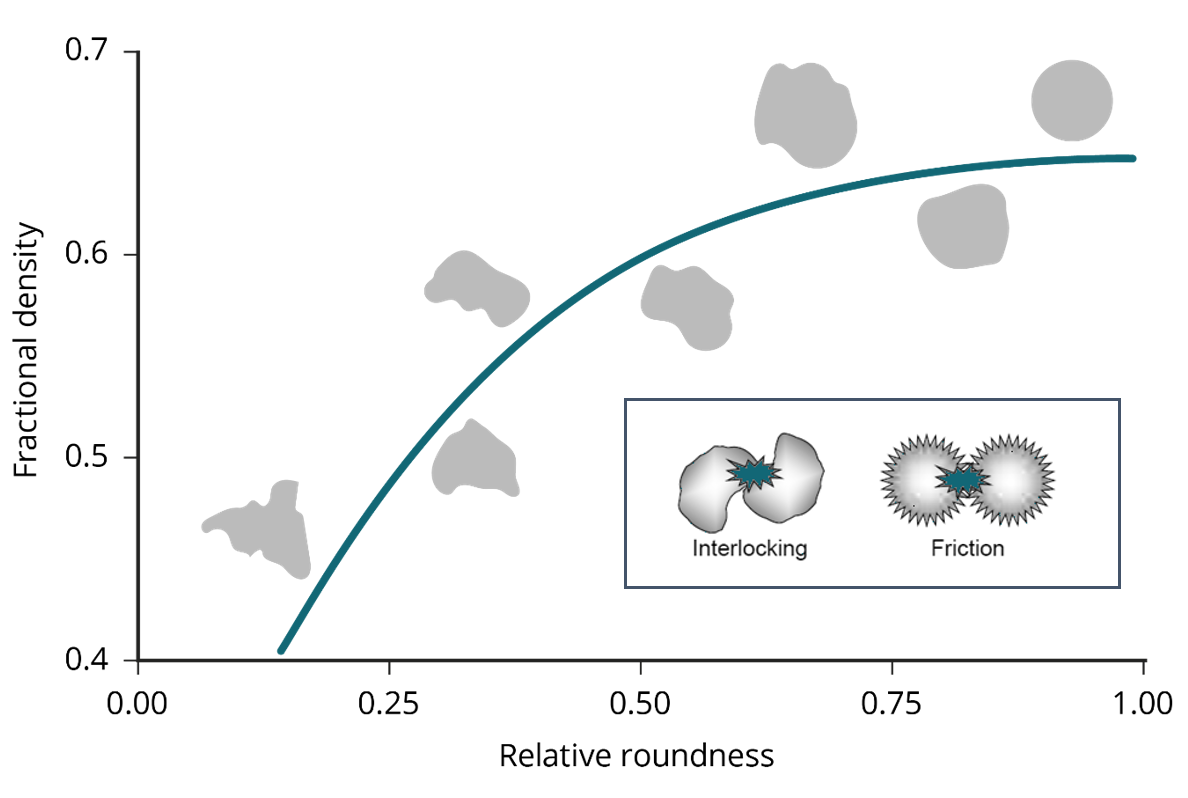
Figure 4. Fractional density (true density / tap density) versus shape and frictional forces caused by surface irregularities.
In general, metal powders for additive layer manufacture are specified for size to be between 15-45 µm for Selective Laser Melting and 45-106 µm for Electron Beam Melting with a spherical morphology preferred [7]. As such, technologies that measure particle size and shape are used for quality control. However, the challenge doesn’t end there because in order to benefit from the efficient use of material, the powder is ideally recycled for the next build. In doing so, the quality of the successive builds is often found to decline leading to part failure. With typical build times between 2-5 days, the cost of wastage is high, which would be exacerbated should production volumes increase. The exact causes of failure from powder recycling are yet unknown and different alloys will likely behave in different ways. Nevertheless, the quality of the powder bed and therefore particle morphology is often cited. But how to characterize this?
Three stand-out techniques are commonly used to characterize both particle size and shape in additive layer manufacture; dynamic image analysis, automated static image analysis and Scanning Electron Microscopy (SEM). The simplest way to differentiate these techniques is by comparing the number of particles imaged and the resolution of those images [8]:
In this study, three samples of metal powders were analysed for particle size and shape. The first sample was unused ‘virgin’ powder, the second sample was taken after eight builds and the third sample was taken after sixteen builds. These samples were analysed using the Morphologi 4; an automated static image analysis platform that captures 100,000’s of high-quality particle images for size and shape determination. Figure 5 shows the internal workings of the Morphologi 4, which includes a verification grating, a motorized X, Y, Z stage, a turret of lenses and an integrated sample dispersion unit (SDU). This enables a fully automated run of a standard operating procedure enclosed within the instrument for accurate and reproducible data collection.
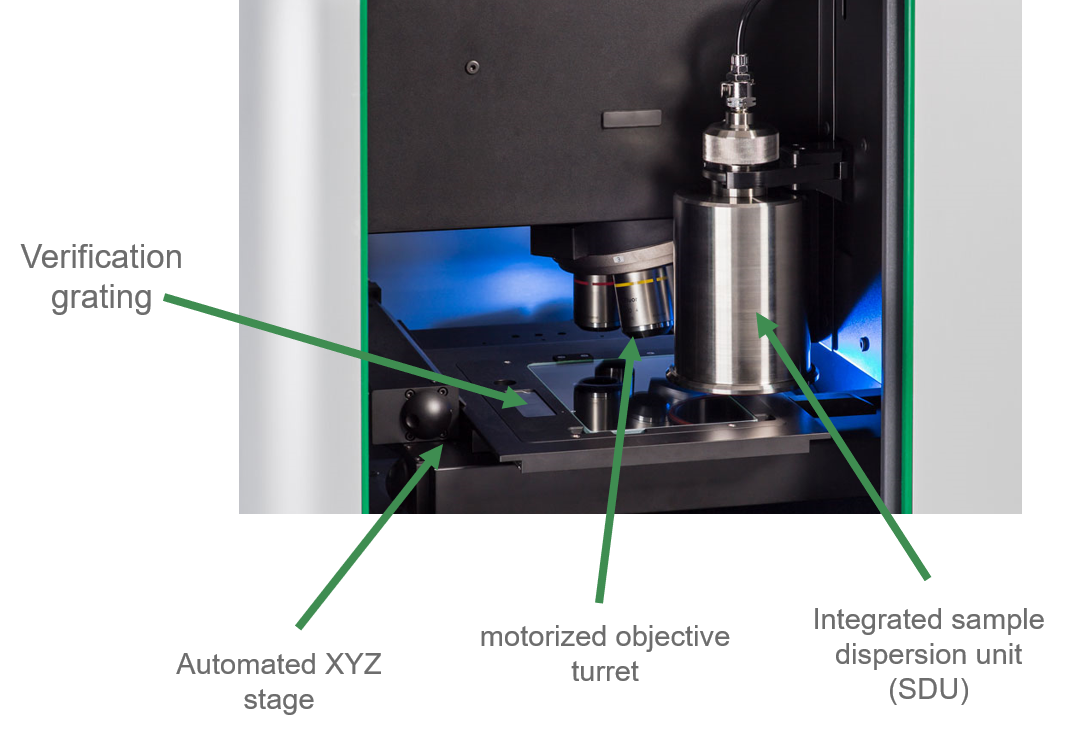 Figure 5. The internal workings of the Morphologi 4
5 mm3 of each sample was automatically dispersed using the SDU at the high energy setting. Each sample was measured using 20× magnification with 2 z-stacks and the Sharp Edge image segmentation method. Figure 6 shows the numeric size distributions of all three samples and the 10th, 50th and 90th percentiles.
 Figure 6. Circular equivalent diameter size distributions of the virgin powder in red (record 1), build 8 in blue (record 2) and build 16 in black (record 3). The 10th, 50th and 90th percentiles are also shown.
All three distributions have a main mode centered around 13 µm but also a fine fraction that extends to below 1 µm. A notable difference is that the virgin powder has a significantly higher fine fraction than the 8th and 16th build; the reduction in the fine fraction is likely to be a consequence of the recycling process. By reducing the fine fraction the flowability tends to improve, however this may also compromise on the packing density [9].
Further inspection of the particle images revealed a diverse variation in shape. Using a combination of image parameters, several classes were set up to group together particles of similar shapes (Figure 7). For example, any particle that had a High Sensitivity (HS) Circularity value of greater than or equal to 0.993 and an Elongation value less than 0.2 was included in a class named “Highly spherical”. Similarly, HS Circularity, Elongation and Solidity were used to describe particles that had “Satellites” and so on.
 Figure 7. Particle classifications with corresponding example particle images.
The percentage of particles in each class can then be compared over multiple records of data (Figure 8). The figure compares the classifications across the three samples where the red bars represent Virgin powder, green were from Build 8 and the blue bars were from Build 16.
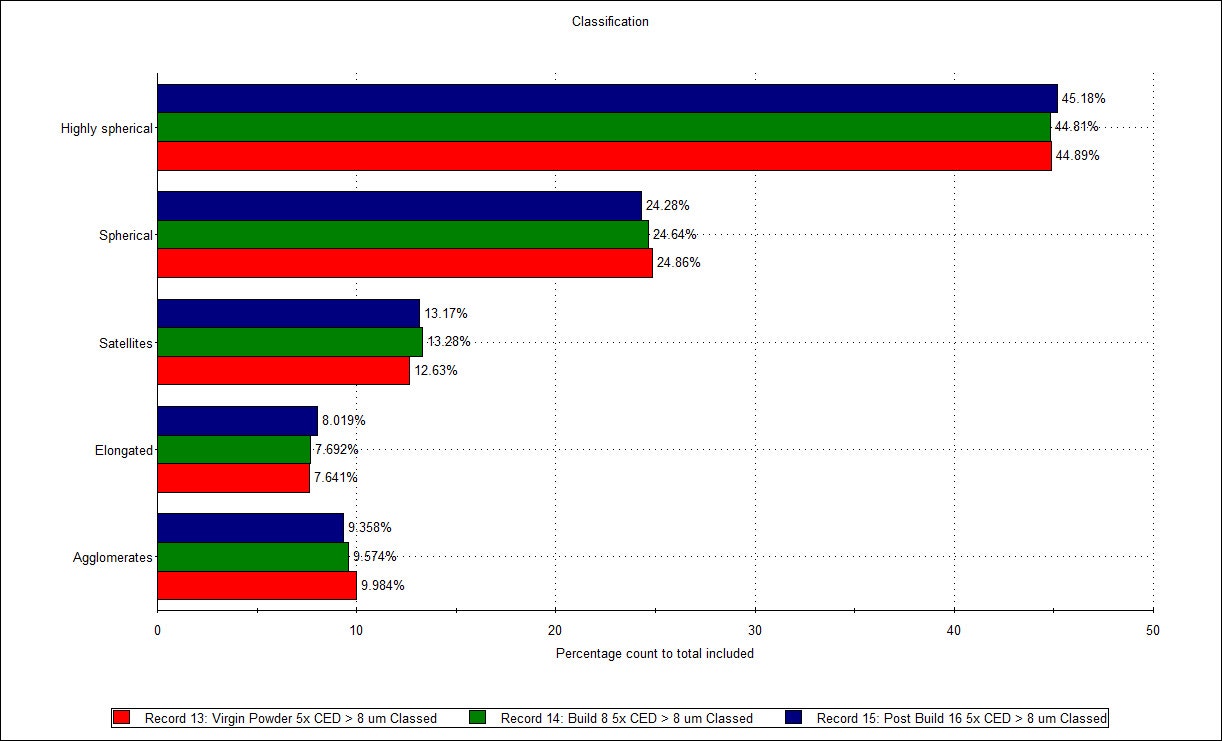 Figure 8. Classification comparison by number percent.
For all three samples, around 70% of the particles were spherical or highly spherical. Around 13% were satellited and the remaining 17% were more irregular in shape, being either elongated or agglomerated. The particles in these last two classifications are likely to reduce flowability and packing density and therefore the quality of the 3D object. However, no significant differences were seen in particle shape between the different build numbers. This would suggest that the powder is suitable for continued use, up to 16 builds.
With long build times per unit, the cost failure in additive layer manufacture is high. The quality of the powder bed is a controlling factor in the quality of the part in build. In turn, this is controlled by the size and shape of particles of the metal powder. By characterizing these properties, it may be possible to forecast when failure might occur and therefore refresh the powder supply before this happens. Automated image analysis is one such solution that can be used to characterize 100,000s of particles to give high quality and statistically relevant morphological information. This single technique combines the quantitative and qualitative benefits of two other commonly techniques in this application; dynamic imaging and SEM.
1. https://wohlersassociates.com/2019report.htm. Accessed April 2020
2. https://www.malvernpanalytical.com/en/learn/events-and-training/webinars/W191022Additive. Accessed April 2020
3. Y.S. Lee and W. Zhang, Mesoscopic simulation of heat transfer and fluid flow in laser powder bed additive manufacturing, 26th Solid Freeform Fabrication Symposium, Austin, Texas, 2015
4. J.P. Bennett & J.D. Smith, Fundamentals of Refractory Technology (Ceramic Transaction Series), Volume 25, 2001, (American Chemical Society)
5. C.N. Davies, Aerosol Science, Academic Press, London and New York, 1966
6. DF. Heaney, Handbook of metal injection molding, Woodhead Publishing, 2012
7. Dunkley, Metal Powder Atomisation Methods for Modern Manufacturing, Johnson Matthey Technol. Rev., 2019, 63, (3)
8. https://www.malvernpanalytical.com/en/learn/knowledge-center/whitepapers/WP1803278ReasonsAnalyticalImagingIsBetter.html. Accessed April 2020
9. L. Cordova, M. Campos, T. Tinga, Revealing the Effects of Powder Reuse for Selective Laser Melting by Powder Characterization, JOM, Vol. 71, No. 3, 2019