Titanium dioxide is widely used as a pigment in products such as paints, coatings, paper, food and cosmetics, due to its high refractive index. In order to achieve maximum efficiency in a wide range of applications, the titanium dioxide particles have to be properly dispersed and maintained in suspension.
Dispersion stability is influenced by the interaction forces between particles. If the repulsive forces present in the sample are weak, the particles will aggregate which can influence the optical properties of the sample. One of the key parameters which can be used to optimize sample dispersion is zeta potential [1-3].
Zeta potential is measured on a Zetasizer Nano using the technique of laser Doppler electrophoresis [4]. In the optical configuration used for zeta potential measurements, the laser beam has to penetrate the sample for scattered light at a forward angle of 13° to be detected. Therefore, in general, samples for zeta potential measurements have to be optically clear. If the concentration of the sample is too high, the laser beam will become attenuated by the particles reducing the scattered light that is being detected.
The high concentration zeta potential cell (ZEN1010) has a reduced path length which allows measurements to be made on turbid samples at high concentration. However, increasing the sample concentration may influence the zeta potential values obtained. This application note discusses measurements made on a titanium dioxide sample. The influence of sample concentration on the measured zeta potential is studied and the concentration limits at which the sample can be measured at are discussed.
Titanium dioxide samples were prepared in 10mM NaCl. Dilution in an indifferent electrolyte, such as NaCl, should ensure that any changes in the zeta potential values obtained are not due to conductivity differences. All measured electrophoretic mobilities were converted into zeta potential using Smoluchowski's formula [1-3].
A range of concentrations (0.001 to 0.3% w/v) of the titanium dioxide sample were prepared and measured on a Zetasizer Nano ZS at 25°C using the high concentration zeta potential cell ZEN1010. A field of 40V was applied across the nominal electrode spacing of 16mm. Five repeat measurements on each sample were made to check the repeatability of the results obtained. Sample viscosities were determined at 25°C using an SV-10 vibroviscometer [5].
A pH titration (pH range 12 to 2 with a pH increment of 1) was also made on the 0.1% w/v sample dispersed in 10mM NaCl at 20°C using NaOH and HCl as the titrants. 3 repeat measure-ments were made at each pH value.
Size characterization of the 0.1% w/v TiO2 sample dispersed in 10mM NaCl was made on a Zetasizer Nano ZS at 25°C.
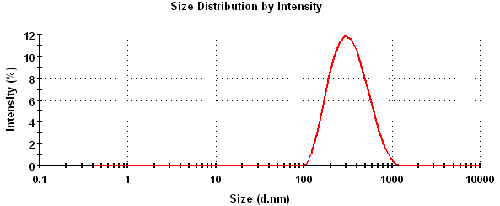
Figure 1 is the intensity particle size distribution obtained from a Zetasizer Nano ZS. The z-average diameter (intensity-weighted mean diameter) was 295nm with a polydispersity index of 0.18.
|
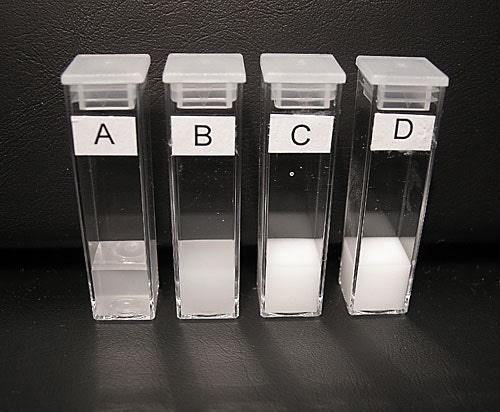
Figure 2 shows cuvettes containing various concentrations of titanium dioxide dispersed in 10mM NaCl measured in the high concentration zeta potential cell in this study. Even though the higher concentrations show very high turbidity, their zeta potentials have still been successfully measured in the ZEN1010 high concentration cell.
|
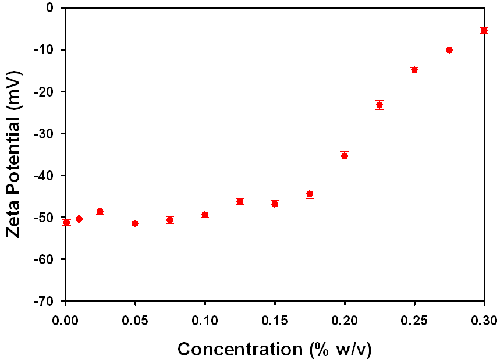
Table 1 summarizes the zeta potential values obtained for various concentrations of the TiO2 sample prepared in 10mM NaCl. The table also includes the measured conductivity values for these samples and illustrates that the presence of 10mM NaCl maintains a consistent ionic strength across the concentration range. The standard deviation values are obtained from the 5 repeat measurements performed on each sample. The zeta potential values are plotted as a function of sample concentration in Figure 3.
|
| Concentration (% w/v) | Zeta Potential (mV) | Standard Deviation (mV) | Conductivity (mS/cm) |
|---|---|---|---|
| 0.001 | -51.3 | 0.7 | 0.97 |
| 0.010 | -50.5 | 0.33 | 0.99 |
| 0.025 | -48.7 | 0.65 | 1.02 |
| 0.050 | -51.5 | 0.66 | 0.99 |
| 0.075 | -50.7 | 0.83 | 0.97 |
| 0.100 | -49.4 | 0.66 | 1.01 |
| 0.125 | -46.3 | 0.67 | 0.98 |
| 0.150 | -46.9 | 0.95 | 0.99 |
| 0.175 | -44.5 | 1.07 | 1.02 |
| 0.200 | -35.4 | 1.08 | 1.01 |
| 0.225 | -23.2 | 1.15 | 1.01 |
| 0.250 | -14.9 | 0.623 | 1.01 |
| 0.275 | -10.1 | 0.85 | 1.01 |
| 0.300 | -5.4 | 0.7 | 0.98 |
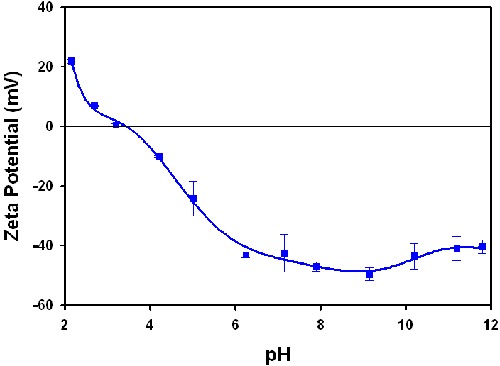
Figure 4 is a plot of the zeta potential of 0.1% w/v TiO2 as a function of pH. The sample has an isoelectric point (point of zero zeta potential) at pH 3.5.
|
The optical configuration of the Zetasizer Nano means that the laser beam has to penetrate the sample for scattered light to be detected at a forward angle. Therefore, in general, samples for zeta potential measurements have to be optically clear.
The maximum concentration at which the zeta potential of a sample can be measured will depend upon a number of factors: particle size, polydispersity of the size distribution and optical properties. The optical properties (refractive index = 2.4) and particle size distribution (figure 1) of titanium dioxide result in very high scattering which produces highly turbid concentrations (figure 2).
The high concentration zeta potential cell, with its reduced path length, allows zeta potential measurements to be made on such samples. The results summarized in this application note confirm that successful measurements can be made on samples which are turbid and at high concentration. However, influence of concentration on the zeta potential results obtained needs to be studied and understood. In the results summarized in table 1 and figure 3, the measured zeta potential values are consistent over a wide range of sample concentrations. The results obtained over the 0.001 to 0.15% w/v have a mean value of -48.9mV with a standard deviation of 2.5mV. However, as the concentration increases above 0.175% w/v, the zeta potential values become less negative.
There are various possibilities for the concentration dependence in the zeta potential results obtained. Dilution may have led to a change in sample equilibrium. This is unlikely as the samples were prepared in a non-specific electrolyte of sufficient concentration (10mM NaCl) to maintain consistent conductivity for each dilution (Table 1). The effect of sample viscosity can also be discounted as, even at the highest concentration measured (0.3% w/v), the viscosity was determined to be that of water (0.89 mPa.s at 25°C).
The most likely explanation is that the increase in sample concentration leads to higher turbidity resulting in obscuration of light transmission. Therefore, the scattered light being detected originates from particles close to the wall, rather than the center, of the cell where they have reduced mobility due to the electric field being lower than assumed.
The isoelectric point at pH 3.5 (figure 3) is consistent for the titanium dioxide crystalline form anatase and the results confirm that pH titrations of very turbid samples can be performed with the high concentration cell.
The high concentration zeta potential cell accessory (ZEN1010) for the Zetasizer Nano series allows measurements to be made on concentrated, turbid suspensions and the results reported in this application note support that. This ability to measure more concentrated samples than previously achieved is due to the reduced optical path length of the ZEN1010 cell.
The maximum concentration at which the zeta potential of a sample can be measured will depend upon the particle size, polydispersity of the size distribution and the optical properties of sample. The larger the particle size, the lower the maximum concentration becomes at which the sample can be successfully measured. The higher the relative refractive index, the lower the concentration at which the sample must be measured.
Even though the zeta potential of more concentrated samples can now be measured, the influence of concentration on the results obtained needs to be studied and understood. It is recommended that a suitable concentration range should be identified where the zeta potential measured is independent of concentration. The results obtained in this study show that it is possible to measure titanium dioxide slurries up to 0.3% w/v concentration. However, an appropriate concentration range would extend to 0.175% w/v for this example as the zeta potential values obtained up to this point are consistent. At concentrations above this limit, the zeta potential values obtained are difficult to interpret and the results should only be used in a relative, not absolute, sense.
[1] Zeta Potential - An Introduction in 30 Minutes, Malvern Instruments Technical Note MRK 654-01.
[2] Hunter, R.J. (1988) Zeta Potential In Colloid Science: Principles And Applications, Academic Press, UK.
[3] Everett, D.H. (1994) Basic Principles of Colloid Science, The Royal Society of Chemistry, UK.
[4] Measuring Zeta Potential Using Laser Doppler Electrophoresis, Malvern Instruments Technical Note MRK 570-01.
[5] SV-10 Vibro-Viscometer, Malvern Instruments Technical Note MRK 650-01.