This application note describes how Size Exclusion Chromatography (SEC) can be used to separate proteins and aggregates into individual populations according to their size. The addition of an additional detector, able to make measurements by both Dynamic and Static Light Scattering (DLS and SLS), allows the size, molecular weight and oligomeric state of the populations to be measured.
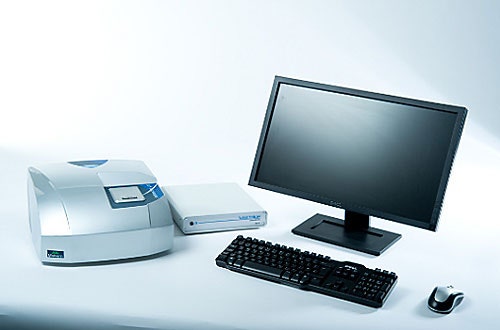
The Zetasizer μV is a dynamic and static light scattering (DLS & SLS) system capable of making measurements of molecular size and molecular weight in a batch cuvette and also when connected to a size-exclusion chromatography (SEC) system in conjunction with an OmniFACE connection box (figure 1).
|
The Zetasizer μV has a 90° detection angle with excellent signal-to-noise and a variable power laser and attenuator to help it achieve a wide dynamic range with respect to the light scattering count rate. Additionally, the light scattering volume, which is the intersection of the illuminating laser and detector field, is very small. This allows very small volumes of sample to be measured. In a batch cuvette, measurements can be made in as little as 2 μl while the flow cell used with the system is just 8 μl. Switching between batch and chromatography modes takes only seconds for the removal of the batch cuvette and insertion of the flow cuvette or vice versa.
The application arena for the Zetasizer μV is primarily the characterization of proteins. This application note describes the measurement of two proteins in batch and chromatographic modes.
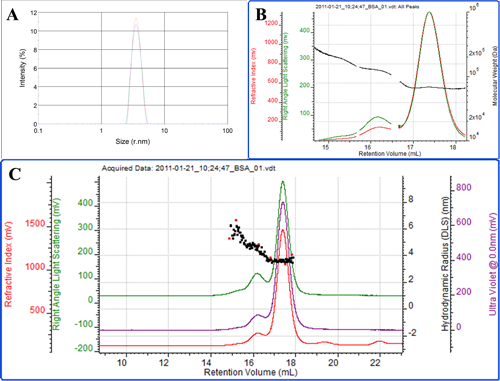
The first protein measured is bovine serum albumin (BSA). Figure 2A shows a batch DLS measurement of the protein. One peak is observed demonstrating that this is a very 'clean' sample with no aggregated material present. The Z-average radius of the peak is 3.7 nm which is slightly larger than a pure BSA monomer. Furthermore, the polydispersity index (PDI) is measured to be 0.16. This indicates that the population is slightly polydisperse. BSA is known to form oligomers such as dimers and trimmers in solution. Cuvette-based batch DLS measurements are unable to resolve the individual oligomers so the sample appears as a single peak with a higher polydispersity.
|
Figure 2C shows the same BSA sample measured by the Zetasizer μV in chromatographic mode. In this case the system is connected to third party ultraviolet (UV; purple) and refractive index (RI; red) detectors. The light scattering intensity trace is shown in green. SEC separates molecules with the smallest ones eluting last. The Zetasizer μV can measure both the molecular weight with SLS and the size by DLS, both of which can be used to clearly identify each peak. The molecular weights of the peaks identify the main peak as the monomer, the secondary peak as the dimer and the shoulder on the leading edge of the dimer peak as the trimmer (figure 2B). The measured radii of the 3 peaks are 3.5, 4.5 and 5.4 nm respectively (figure 2C). The resolution of the SEC therefore allows each of the individual populations to be measured. Within the monomer and dimer peaks, the stability of the molecular weight and size (which represents the peak polydispersity) shows that each peak is a single form of the protein (Figure 2B). The shoulder representing the trimmer tails upwards slightly and this is likely due to the fact that a very small amount of higher order oligomers are co-eluting in this region. The total amount of dimer and trimmer in the protein sample is measured to be slightly less than 10%. The contribution of these two populations explains the slightly higher Z-average in batch DLS compared with the monomer alone.
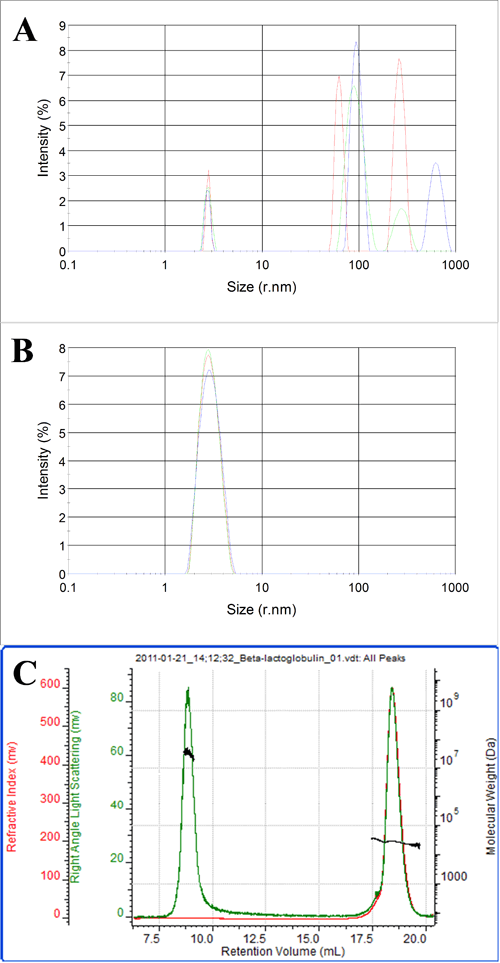
Figures 3 and 4 show batch and chromatographic measurements of β-lactoglobulin. In this case, the batch DLS measurements are shown before and after filtration of the sample through a 0.02 μm filter. Figure 3A shows the sample prior to filtration. A consistent population with a radius of 2.8 nm is visible across three repeat measurements. This is clearly the β-lactoglobulin. The three measurements, however, all show extra peaks ranging from 30 nm up to 1 μm in size. This is evidence of aggregated material present in the sample. The PDI in this case is 0.8 due to the presence of the aggregates and the Z-average, is approximately 100 nm.
|
After filtration through a 0.02 μm filter, only one population is present in the sample. The Z-average is 2.8 nm and the PDI is 0.07 which is more typical for a monodisperse protein sample. This shows that all the aggregated material has been removed by the sample filtration.
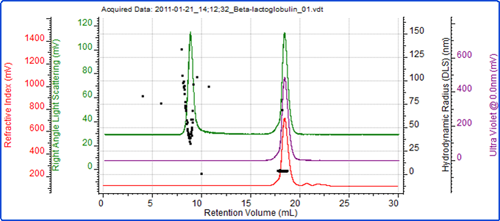
Figure 4 shows a SEC measurement of the unfiltered sample. Two peaks are clearly visible. The molecular weight of the peak eluting after 18 ml identifies this peak as the β-lactoglobulin. The low polydispersity of the size and molecular weight both indicate that this is a stable form of the protein.
|
The first peak in the chromatogram is very significant by light scattering compared with UV and RI and this is easily identified as the aggregated material present in the sample. The variation of the size (figure 3C) and molecular weight (figure 4) within the peak show it to be highly unstable as expected with protein aggregates when compared with oligomers.
The polydispersity of the aggregate peak also explains the variability of the size of the aggregate peak in the batch DLS measurements.
The Zetasizer μV is capable of making size and molecular weight measurements in both batch and chromatographic modes. DLS is a very quick and simple measurement. In this case, in batch mode, it can be used to quickly identify and measure the size of the protein in small sample volumes and in a non-invasive manner. The sensitivity of DLS to larger species makes it ideal for identifying aggregated material within a sample as seen here in the example of β-lactoglobulin.
SEC can be used to separate the individual populations within a polydisperse sample. Using SLS and DLS, both the size and molecular weight of the populations can be measured. These can be used to characterize the state of oligomerization. At the same time, the amount of aggregated material, identified in batch DLS, can be quantified.