urface zeta determination is illustrated at the example of a silica microscope slide surface, with schematic of electroosmosis and electrophoresis, The zeta varies between -60mV at pH9 to +20mV at pH3.
This application note discusses the measurement of the surface zeta potential of silica using the surface zeta potential cell accessory for the Zetasizer Nano series of instruments.
|
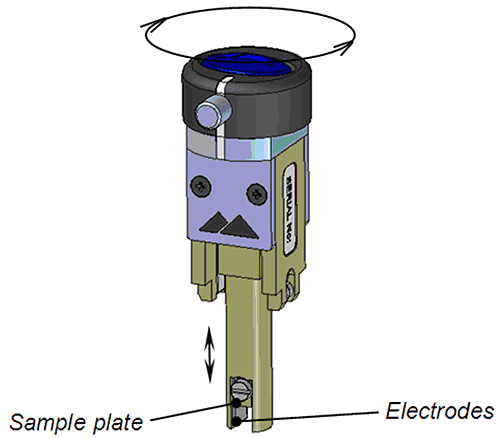
In the surface zeta potential cell, a sample of the surface of interest is placed between two electrodes. The vertical position of the sample is moved with respect to the detection optics by an adjuster at the top of the cell (Figure 1). The cell is placed in a standard 12mm2 cuvette filled with a dispersant and tracer particles and the cuvette and cell inserted into the Zetasizer Nano instrument.
|
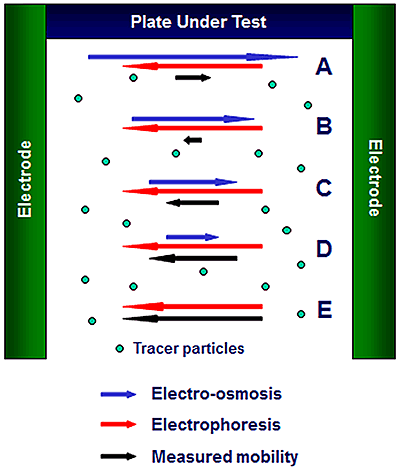
The surface zeta potential is determined by the detection of the movement of tracer particles dispersed in the electrolyte alongside the surface under test (Figure 2). On the application of an external electric field, the tracer particles move under the influence of both the electro-osmotic motion of the fluid (blue vectors) and their own electrophoretic motion (red vectors). The subsequent total detected motion is given by the sum of these (black vectors). The field strength is estimated by measuring the conductivity of the liquid phase of the sample and then back calculating from a current measurement during the application of the field.
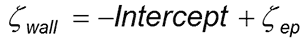
As the optical detection position moves away from the surface A to D, the electroosmotic contribution to the resulting motion reduces in value until at some position E, the detected motion is only the electrophoretic motion of the tracer from which the tracer zeta potential ζep can be calculated. The y-axis intercept is extrapolated from the linear fit to the data (A to D) and the surface zeta potential ζwall at the slipping plane (y=0) is then given by following equation:
|
pH 9.2 buffer, KCl, KOH and HCl were all obtained from Sigma-Aldrich (Dorset, UK). The silica was cut from an uncoated microscope slide and the test plate sample was cut to 4mm width, the spacing of the dip cell electrodes, <8.0mm in length and were generally no more than 1.5mm in thickness.
The tracer particles used were Coffee Compliment milk substitute obtained from Premier Foods UK in predispersed form.
Titrations of surface potential against pH of silica were conducted in 1mM KCl and the pH varied using HCl and KOH. Each pH point was a separate measurement sequence using the cell.
|
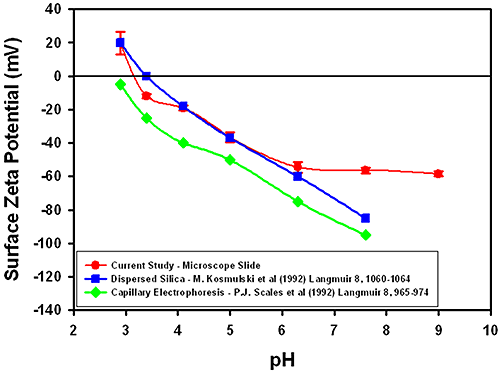
Figure 3 summarizes the surface zeta potential results obtained for silica at different pH values. The graph also shows results obtained from the measurement of dispersed silica particles [1] and capillary electroosmosis data [2]. The plot shows that the results obtained with the surface zeta potential cell are in good agreement with studies at all pH values tested in the region of the iso-electric point (IEP). There is less general agreement at higher pH values but this appears to be a general feature of all techniques.
The error bars in the plot suggest that there does not seem to be a trend between the uncertainty and pH, with a typical uncertainty of ± 2 to 3 mV.
|
|
|
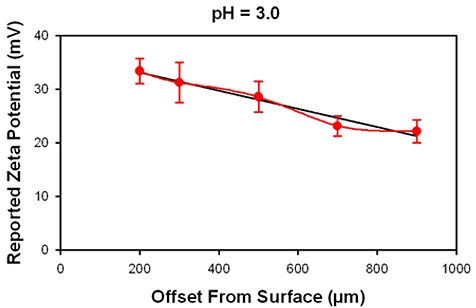
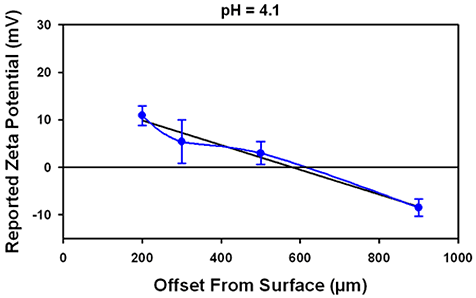
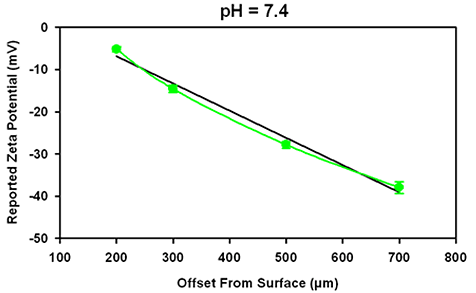
Figure 4 shows the data obtained at 3 different pH values. The iso-electric point for this oil in water emulsion is at pH 4. No increase in uncertainty in the reported surface potential is detected either when the surface IEP is at approximately the same value as the surface or at a different value, indicating that the IEP of the tracer may be ignored.
This application note summarizes the measurement of the surface zeta potential of silica using the surface zeta potential cell accessory for the Zetasizer Nano. The results obtained are in very good agreement with values obtained from other techniques.
[1] M. Kosmulski and E. Matijevic (1992) Langmuir 8, 1060-1064.
[2] P.J. Scales, F. Grieser and T.W. Healy (1992) Langmuir 8, 965-974.