This article describes the automated borate fusion method designed to obtain the full dissolution of common lime products such as limestone, dolomite, calcium hydroxide and residues, without the need of harsh acids or extensive sample dissolution for ICP-OES determination.
Limestone (CaCO3) is an inorganic mineral found in abundance all over the world[1]. In its natural form it is often strip mined, crushed and processed according to the desired end-use. Two basic types of lime are produced: those with a high calcium content, termed "high calcium" (CaO), and those with a high magnesium and calcium content, termed “dolomitic lime” (MgO•CaO). The determination of metals in lime samples by inductively coupled plasma combined with optical emission spectrometry (ICP-OES) is not difficult to perform in itself but will require multiple steps if approached with acid digestions in mind. A single method that could include all raw, finished and waste products involved in lime production would be very appealing to many because of increased productivity factors.
This article describes the automated borate fusion method designed to obtain the full dissolution of common lime products such as limestone, dolomite, calcium hydroxide and residues, without the need of harsh acids[2,3] or extensive sample dissolution for ICP-OES determination.
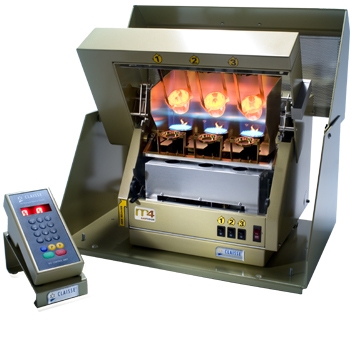 Figure1. Claisse® M4™ Fluxer
Borate fusions can be performed manually or with automated systems. Although both methods are efficient, the automated systems have the advantage of increasing productivity, improving safety, maintaining repeatable preparation conditions, avoiding spattering as well as cross-contamination. In this project, fusions were performed using a Claisse® M4™ Fluxer (Figure 1). The M4™ is a 3 burner Fluxer which provides quick, safe and complete dissolution for the samples of interest. It was specifically designed to offer inter-burner flame stability for the best repeatability and consistency. The software allows full control over different operating parameters such as speed of agitation, temperature, duration of each step and others. The adjustable parameters allow the user to optimize the fusion process in order to obtain complete dissolution of the samples in the quickest time possible.
Different samples and reference materials were used to validate the developed method (Table 1).
| Sample
| Supplier
|
|---|---|
| Certified Reference Material – Dolomite (SRM 88b)
| NIST
|
| Certified Reference Material - Limestone (ECRM701-1)
| Techlab
|
| Limestone sample ( #505 )
| Lime industry
|
| Dolomite sample ( # 506 )
| Lime industry |
| CaOH sample ( # 507 )
| Lime industry |
| CaO sample ( #508 )
| Lime industry |
| Lime Kiln Dust ( Residues – LKD ) ( # 509 )
| Lime industry |
"The success of the borate fusion approach resides in the simplicity of the method; its speed; automation and the absence of harsh acids."
The content of the Teflon® beakers was diluted by a factor of 2 and an aliquot was transferred to a 100 mL flask and brought up to volume with the acid solution. The solution was then ready to be analyzed by ICP-OES.
The measurements were performed using the PerkinElmer® Optima™ 7300 DV ICP-OES instrument (Figure 2). It is equipped with the WinLab32™ for ICP Version 4,0 software. On this particular instrument, the ICP torch is mounted in a horizontal orientation in the instrument’s shielded torch box, but can be viewed either axially or radially.
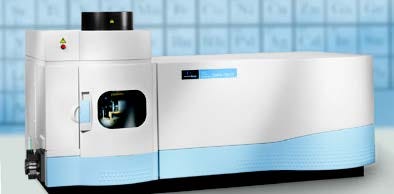
Figure 2 . PerkinElmer® Optima™ 7300 DV ICP-OES
A Scott Spray Chamber with Gem Tip Cross Flow Nebulizer (Figure 3) was selected as an introduction system because of its proven reliability, robustness and capability to handle high dissolved solids.
The viewing mode is user-selectable on an element-byelement basis. A shear gas flow (compressed air) eliminates the cool plasma tail and allows a direct observation of the plasma’s normal analytical zone, thus minimizing chemical matrix effects when the axial-view mode is employed.
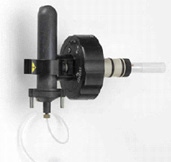
Figure 3 . Scott Spray Chamber with Gem Tip Cross Flow Nebulizer
By combining a SCD detector and an Echelle optical system, the Optima™ 7300 DV ICP-OES can measure all the wavelengths simultaneously. Its wavelength flexibility allows the end user to easily add new elements or wavelengths as the programs change.
Another benefit of using the Optima™ for fusion samples includes a 40 MHz free-running solid state RF generator designed to operate between 750 to 1500 W in 1 W increments. High RF power is required to generate a robust plasma, essential for precise analysis of high matrix samples such as fusion samples (refer to Table 2 for detailed Optima™ 7300 DV operating parameters)[5].
| Nebulizer
| Gem Tip Cross flow
|
| Spray Chamber
| Scott
|
| Injector
| Alumina
|
| RF
| 1500 W
|
| Argon Flow rate
| Plasma: 16,0 L/min
Nebulizer: 0,8 L/min Auxiliary: 0,4 L/min |
| Shear gas
| 100 psi
|
| Sample flow rate
| 1,0 mL/min
|
The following criteria were taken into consideration in selecting the wavelength: (a) the freedom from spectral interferences; (b) the different sensitivities and expected concentration in the samples. The most sensitive line was not always used in order to avoid spectral interferences and to remain in the linear range. Observed interferences were compensated for by modifying the processing parameters (e.g. adjusting the background correction points, applying multi-component spectral fittings (MSF) or inter-elemental corrections (IEC)).
Method detection limits (MDLs) were based on ten replicate measurements of a series of low concentration or diluted sample solutions. The MDL was calculated by multiplying the standard deviation of the ten replicate measurements by 3[6] and the correction factor:
MDL = 3 x S10 x CDF
Where: S10 = Std Deviation of the ten replicates CDF = Corrected Dilution Factor
Table 3 demonstrates analytes of interest with selected wavelengths, viewing modes and method detection limits (MDL).
| Element
| Wavelength
| Viewing mode
| MDL ( mg/Kg )
|
|---|---|---|---|
| Al
| 396,153
| Axial
| 3
|
| Ca
| 227,546
| Radial
| 125
|
| Fe
| 238,204
| Axial
| 3
|
| Mg
| 279,077
| Axial
| 25
|
| Mn
| 259,372
| Axial
| 1
|
| Si
| 288,158
| Axial
| 6
|
| Ti
| 368,519
| Axial
| 1
|
The accuracy and precision of the method were evaluated. The accuracy was determined by calculating the elemental recovery of certified reference materials (CRMs). The precision was determined by preparing and measuring 10 replicates of the various CRMs. The results for each CRM are presented in Tables 4 and 5. The accuracy and precision obtained demonstrate that the developed method performed very well.
| Element
| Wavelength
| Average Experimental values
( % ) n = 10 | Certified values
( % ) | Accuracy
( % ) | Precision
( % ) |
|---|---|---|---|---|---|
| Al
| 396,153
| 0,29
| 0,29
| 99
| 3
|
| Ca
| 227,546
| 38,2
| 37,7
| 102
| 4
|
| Fe
| 238,204
| 0,69
| 0,73
| 95
| 3
|
| Mg
| 279,077
| 0,37
| 0,36
| 102
| 3
|
| Mn
| 259,372
| 0,02
| 0,02
| 98
| 3
|
| Si
| 288,158
| 0,95
| 0,93
| 102
| 3
|
| Ti
| 368,519
| 0,02
| 0,02
| 103
| 3
|
| Element
| Wavelength
| Average Experimental values
( % ) n = 10 | Certified values
( % ) | Accuracy
( % ) | Precision
( % ) |
|---|---|---|---|---|---|
| Al
| 396,153
| 0,18
| 0,18
| 104
| 1
|
| Ca
| 227,546
| 21,1
| 21,4
| 98
| 1
|
| Fe
| 238,204
| 0,19
| 0,19
| 99
| 1
|
| Mg
| 279,077
| 12,8
| 12,7
| 101
| 1
|
| Mn
| 259,372
| 0,01
| 0,01 | 115
| 1
|
| Si
| 288,158
| 0,52
| 0,53
| 99
| 3
|
| Ti
| 368,519
| 0,01
| -
| -
| 1
|
Pre-fusion spikes were performed on samples and CRMs (Table 6) to monitor the accuracy of the elemental recoveries and further validate the method.
| Element
| Wavelength
| #505
( % ) | #506
( % ) | #507
( % ) | #508
( % ) | #509
( % ) | ECRM 701-1
( % ) | SRM 88b
( % ) |
|---|---|---|---|---|---|---|---|---|
| Al
| 396,153
| 114
| 103
| 104
| 112
| 95
| 103
| 101
|
| Ca
| 227,546
| 102
| 92
| 103
| 88
| 95
| 95
| 91
|
| Fe | 238,204 | 100
| 76
| 90
| 85
| 92
| 67
| 91
|
| Mg
| 279,077
| 104
| 91
| 88
| 90
| 89
| 87
| 91
|
| Mn
| 259,372
| 95
| 98
| 91
| 91
| 93
| 96
| 97
|
| Si
| 288,158
| 99
| 80
| 96
| 92
| 86
| 91
| 93
|
| Ti
| 368,519
| 108
| 99
| 94
| 92
| 93
| 100
| 101
|
Borate fusions combined with the simultaneous ICP-OES (Optima™ 7300 DV) have the analytical capabilities to perform the analysis of limestone and lime products with good accuracy, precision, recovery, analysis speed and robustness and fulfills the requirements normally set for the analysis of high matrix samples such as fusion samples. Metal components were measured in a variety of samples and reference materials, demonstrating good accuracy. The borate fusion approach to dissolution of lime products is an excellent alternative as its success resides in the simplicity of the method; its speed (complete sample dissolution in less than 12 minutes); automation and the absence of harsh acids. Furthermore, this technique does not require highly skilled operators.
1. www.webcitation.org/query?id = 1257008095152489, MSN Encarta
2. ASTM C25 – 06 : Standard Test Methods for Chemical Analysis of Limestone, Quicklime, And Hydrated Lime
3. An assessment of dissolution techniques for the analysis of geological samples by plasma spectrometry, Chemical Geology, 1992, 95, 35-62 Author: Marina Totland, Ian Jarvis and Kim E. Jarvis
4. www.malvernpanalytical.com/en/products/product-range/claisse-range/m4, Claisse® Inc.
5. Trace Metal Characterization of Soils using the Optima 7300DV ICP-OES, PerkinElmer® Inc., Application Note, Author: Praveen Sarojam, PhD.
6. Protocole pour la validation d'une méthode d'analyse en chimie, Centre d'Expertise en Analyse Environnementale du Québec, Ministère de l'Environnement, Document de référence DR-12-VMC, Édition 21 pages.