
Number fluctuations are defined as variations in the number of particles within the scattering volume during the course of a dynamic light scattering (DLS) measurement. As a consequence of Brownian motion, particles within the scattering volume are moving, leading to constructive and destructive interference effects at the detector. In DLS instruments, these intensity fluctuations are correlated across very small time scales and then transformed to give the diffusion coefficient and subsequently the hydrodynamic size. These intensity fluctuations should be solely due to the Brownian motion of the particles/molecules being measured. However, the assumption is that the number of particles within the scattering volume during the course of the measurement must be constant.
Number fluctuations are generally easy to spot and are typically manifested as elevated baselines and/or discontinuities in the correlation curve and in worst cases, intercept values greater than 1. Examples of typical correlation functions showing number fluctuation problems are shown in Figure 1, together with an example of a good correlation function.
A useful parameter available in the software for identifying the presence of number fluctuations is the "in range". The "in range" parameter describes the overall quality of the size data. It is scaled from 0 to 100% and the higher the value, the better the quality of the data. It is calculated fundamentally by looking at the difference between the measured baseline of the correlation function and the theoretical baseline. The closer the experiment (measured) is to the theory (calculated), the higher the "in range" parameter would be. For example, if the measured and calculated baselines were exactly the same, the "in range" would be 100%. The more the measured baseline deviates from the calculated, the lower the "in range" value becomes. In the Size Quality Report and Expert Advice System, an "in range" value of less than 90% would be highlighted to the user. The most common reason why the "in range" value would become low in value is the presence of large particles/aggregates/dust which cause number fluctuations and hence elevated baselines in the correlation function.
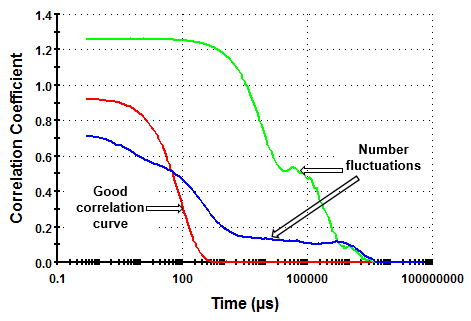
Figure 1:Example correlation functions showing the presence of number fluctuations. In one example, the measured intercept is greater than 1.
Number fluctuations are more problematic with dynamic light scattering instruments that detect scattered light at 90° compared to 173° (Figure 2). The smaller scattering volume associated with 90° detection angle significantly increases the likelihood of number fluctuations if larger particles are present (see Figure 2). As a direct consequence of the smaller scattering volume, the upper size limit for reliable measurements with these systems (such as the Zetasizer µV, APS, Nano S90 and ZS90), is significantly lower than for instruments with 173° detection angles (such as the Nano S, ZS and ZSP).
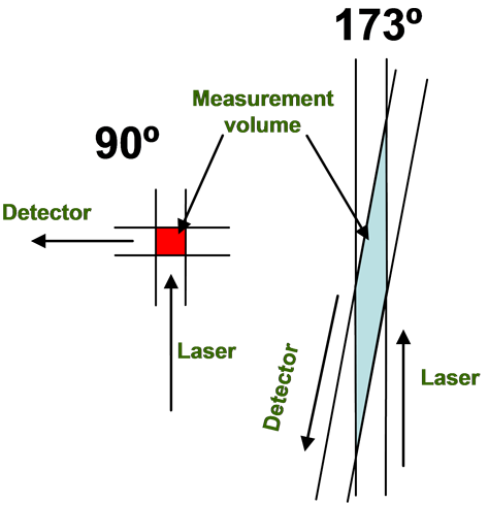
Figure 2:Schematic showing the difference in scattering volumes between a 90° and 173° detection angle DLS instrument.
Factors that can lead to number fluctuations are the presence of small amounts of dust, the presence of sample particles that are outside the range of the technique, or very low sample concentrations. The latter is a factor that can only be addressed by increasing the sample concentration. With regard to dust and very large particles however, one can either spin the sample in a bench top centrifuge for about 5 minutes or let the sample set undisturbed in the cell chamber for 5 to 10 minutes to allow settling of the larger particles, and ultimately achieve reasonable measurement conditions. Alternatively, the sample could be filtered through an appropriate pore size filter to remove the large material.
If the measurement is set up in the Zetasizer software to be run with automatic duration, random number fluctuations are automatically removed from the measured average correlation curve. The measurement is split into a series of 10 second sub runs and the final result will contain 50% of the sub runs with the lowest mean count rates i.e. the sub runs which do not show number fluctuations. However, if each of the sub-runs of data is contaminated by the effect of number fluctuations, then any data will be treated as real and the size distribution results will reflect the presence of very large particles.