Polymer Blend Analysis by GPC-PDA
Overview
Polymers are macromolecules made by the repetition of molecular units. Due to the nature of polymerization reactions, polymers include a molecular weight distribution defined by rheological properties such as strength, flexibility, and hardness. Important physical properties, such as chemical resistance, solubility, density, and permeability, are mainly functions of the polymer’s repeating units.
The three attributes characterizing the molecular weight distribution are number average molecular weight, Mn, weight average molecular weight, Mw, and z-average molecular weight, Mz. Polymer’s molecular weight distribution is defined as Mw/Mn. Bulk polymers can have different properties due to molecular weight, albeit polymers with the same average molecular weight may differ in properties due to the distribution of molecular weight.
Polymer blends are used to optimize the physical and rheological properties of bulk polymer samples. Characterizing polymer component ratios, like molecular weight and dispersities, is important. One method of analyzing polymers in a solution is Gel Permeation Chromatography (GPC), also known as Size Exclusion Chromatography (SEC).
Viscotek produces good chromatography that is a prerequisite for GPC data accuracy. Good chromatography implies the separation mechanism in columns should lead to pure sample stearic separation, and no overload should occur in the column.
Recent work is incorporating fiber, organic electronics, and bio-pharmaceutical application fields leading the development of photon diode arrays (PDA), detected as diagnostic tools, accompanied by sample matrices with multiple elements.
PDA, also called a diode array detector, is an inline detector that measures a complete absorption spectrum of a dissolved sample each time, analyzing chromatograms to provide characteristics of components. Different polymer absorption profiles enable differentiation despite having a similar molecular weight, refractive index, viscosity, or hydrodynamic diameter. This application note focuses on a novel PDA detection method for polymer blend analysis.
Experiment
A blend of 5% Polystyrene (PS) and 95% polymethylmethacrylate (PMMA) was prepared, with concentrations recorded in weight%. Each sample was duplicated with an injector volume of 100μL and analyzed. The overall sample concentration was 2 mg/ml. The eluent was THF at 1 mL/min rate. Columns and detectors were set at 30 °C to ensure the best reproducibility. ViscoGEL I-series (IMBHMW-3078) columns were used to achieve target results.
Generally, concentration in GPC is measured with the RI detector, but in this note, a photo diode array (PDA) was used to find polymers in blends using different absorption profiles.
Results
Table 1 shows a typical chromatogram using the Viscotek Tetra detector platform. While RI and viscometer respond, the presence of two component elements is not distinctly shown, and light scattering detectors exhibit a small shoulder at the high molecular weight end of the chromatogram. However, it’s uncertain if two components exist in the sample matrix. Such artificial defects are due to aggregation and blending. Using Viscotek’s PDA detector allows clear distinction between two components.

Figure 2 shows UV absorption chromatograms at two different wavelengths, 237 and 261nm. The PDA simultaneously records all wavelengths, so absorption of PMMA (237 nm) and PS (261 nm) is seen. Controversially, the same result may be achieved with a dual-wavelength UV-vis detector, albeit absorption wavelengths must be pre-ascertained. This occurs when only two absorption bands are detected or when low molecular weight polymers or impurities are not present. Using a PDA to view all spectra simplifies finding different polymers within blends. From the qualitative analysis in Figure 2, it’s clear that the PS component elutes first and is thus larger than the PMMA component.

OmniSEC software provides various ways to visualize and evaluate PDA data. Figure 3 uses a contour plot comparing the absorption wavelength at retention times to directly show the presence of two polymer fragments in the sample matrix. This conclusion is drawn from the existence of two major absorption peaks, having different peak wavelengths, intensities, and retention times. Such values are not feasible in RI, LS, and viscometer chromatograms shown in Table 1.

Figure 2 shows the two wavelengths 237 and 261nm using the contour plot presented in Figure 3. It offers an easy wavelength selection by providing a diagram correlating best absorption and time.
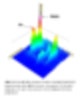
Extension of the contour plot in the Z-axis allows 3D plotting analyzable by users at any angle, distinctly highlighting the sample’s two components. It also shows by-products or unreacted low molecular weight precursors at the chromatogram end (long retention time). This is useful for qualitative polymerization optimization studies (Figure 4).
Viscotek’s PDA, one of the most useful and important diagnostic tools for polymerization analysis, offers functionality similar to UV-vis absorption comparisons of a sample’s molecular weight (Figure 5). A PMMA:PS (30:70) blend was measured using this chromatogram. Using Viscotek’s advanced detection platform, absolute molecular weight distribution is attainable. The plotting compared with PDA data provides the sample matrix’s absorption profile, showing PMMA within the blend has a lower molecular weight compared to PS and demonstrates higher polydispersity (PDI) as seen in Figure 5.

Conclusion
Finally, analyzing polymer blends and their components with Viscotek’s PDA detector and software is proven to have superior detection capabilities. PDA provides easy visualization of blends and versatile functionality for analyzing and measuring homopolymers and blends due to the flexibility in wavelength selection.
{{ product.product_name }}
{{ product.product_strapline }}
{{ product.product_lede }}
