What is a dn/dc value and why is it important for GPC/SEC?

The most common detector in any GPC/SEC instrument is a refractive index (RI) detector. There are multiple reasons for this, but the most important is because the difference in refractive index between that of a sample solution and that of the same solvent without a sample is directly proportional to the concentration of the sample. This is why RI detectors are referred to as concentration detectors. (It should be noted that UV-Vis detectors are also concentration detectors, but require the sample has a chromophore and absorbs light at a detectable wavelength).
When used as the only detector in a GPC/SEC system, the relative concentrations of the different data slices in a sample peak can be determined, which, when combined with a calibration curve, allows for the calculation of the relative molecular weight moments (Mn, Mw, Mz). When an RI detector is combined with light scattering and viscometer detectors, the exact concentration of the sample at each data slice needs to be determined in order to calculate the absolute molecular weight and intrinsic viscosity. And how do we get the exact concentration of a sample at each data slice? By using the sample’s dn/dc value.
What is dn/dc?
The key parameter for translating RI detector output to exact sample concentration is the dn/dc value, or refractive index increment. This value is unique for a sample-solvent combination, as it represents the difference in refractive index between the sample and the solvent. (Other factors can affect a sample’s dn/dc value, such as the light source wavelength and extremely low molecular weights, but those situations are rare). Typically, dn/dc values range from 0.05 – 0.20, with higher dn/dc values providing stronger RI responses. Sometimes a sample and solvent have the same refractive index, such as polydimethylsiloxane (PDMS) and THF, which results in a dn/dc value of zero. This means that no matter how concentrated the sample solution, the RI detector will show no response.
The following example illustrates how the dn/dc of a sample affects its RI response. Two samples were prepared and analyzed on the OMNISEC system; one polystyrene (PS) and one polymethyl methacrylate (PMMA), both with concentrations of 2 mg/mL. This means the same amount of mass was injected for both samples. Since the RI detector measures concentration, the initial expectation might be that the two peaks would be of similar size and area.
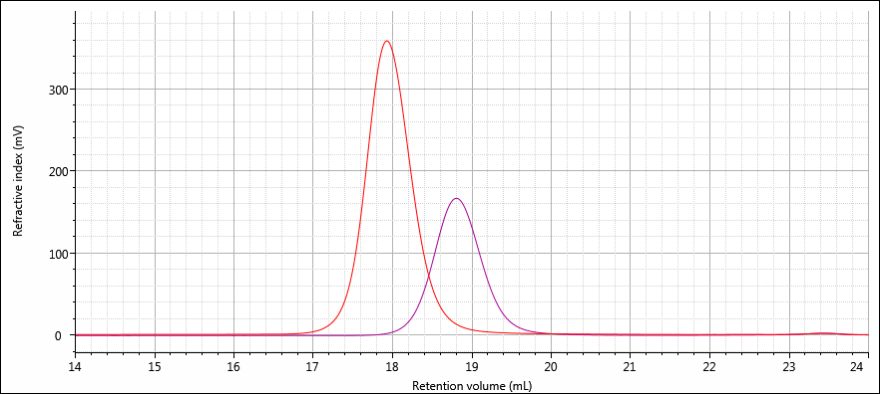
The resulting RI signals, however, show a clear difference: the PS sample peak (red) is more than twice as large as that produced by the PMMA (purple). If both samples have the same concentration, why are their peaks so different?
As you might expect, the answer is that PS and PMMA have different dn/dc values. The dn/dc value for PS in THF is 0.185 and the dn/dc value for PMMA in THF is 0.085. The value for PS is a little more than twice that of PMMA, which results in a peak that appears to be about twice as large. In fact, the peak area of the PS sample is 253.3 mV•mL, a little more than twice the peak area of the PMMA signal, 122.5 mV•mL.
A collection of dn/dc values for common sample types in various solvents can conveniently be found in this previous blog post.
Why is dn/dc important?
As hinted at earlier, when analyzing samples using a GPC/SEC system with advanced detectors knowing the exact concentration of the sample at each data slice is critical. The calculation of all molecular parameters from the light scattering, viscometer, and UV detectors is dependent on knowing the sample concentration, as indicated in the equations below. When the dn/dc value is known, a sample of unknown concentration can be analyzed and the RI signal can be used to determine the concentration. This concentration is then applied to the other detector equations allowing for the calculation of molecular weight, IV, and other related properties. Ultimately, the dn/dc value is important because it is the link that translates the raw RI signal to sample concentration.

Taking advantage of the direct relationship between concentration and dn/dc value, there is a way to use the OMNISEC software to easily calculate an unknown dn/dc value. The one requirement is that the sample is completely soluble in the dissolution solvent and mobile phase so that the input concentration corresponds to the mass of the sample observed by the detectors. The software will assume a 100% sample recovery, and by knowing the input concentration and injection volume will relate the amount of mass injected into the system to the RI signal observed. Since the concentration is known in this case, the only unknown parameter in the RI equation listed above is the dn/dc value, which the software will calculate and display. A more thorough version of this approach is to analyze a dilution series of a sample and obtain the dn/dc value from the relationship between the RI response and the various sample concentrations. However, these methods fall short when the sample concentration or purity is not known, the sample is not completely soluble, or any other situation in which the assumption of 100% recovery cannot be met.
What are the effects of dn/dc?
In addition to being vital to calculate characterization data for your sample, the dn/dc value can affect your raw data in ways you might not realize. The first way was touched upon earlier, in that the magnitude of the dn/dc value will affect the peak height and area. Also mentioned was the situation in which the dn/dc of a sample is zero, resulting in no sample peak. While most samples have positive dn/dc values, in which their refractive index is higher than that of the mobile phase producing a positive sample peak, that’s not always the case. There are some sample-solvent combinations that lead to a negative dn/dc value for the sample, the most common being polyolefins in 1,2,4-trichlorobenzene (TCB). This leads to interesting looking chromatograms, such as the triple detector chromatogram for a polyethylene sample in TCB below, where the RI signal shows a negative peak while the other detectors present positive peaks. If you encounter a sample like this there’s no need to worry – the software can handle negative RI peaks just as easily as positive ones.

More common than negative sample peaks are negative solvent peaks. These typically appear at the void volume of the column at the end of an analysis. The negative peak between 32-33 mL in the above chromatogram is an example of this. Differences between the dissolution solvent and mobile phase will produce any number of positive and/or negative peaks in this region. Due to the sensitivity of the RI detector, these dn/dc differences can be as slight as the amount of moisture absorbed by the mobile phase vs. the dissolution solvent, the presence of salt in one or the other, or even the use of two different bottles of the same commercial solvent. The good thing is that as long as they’re resolved from the sample peak they don’t affect the data analysis process at all.
If you refer back to the list of detector response equations you’ll see that the dn/dc value is also included in the light scattering equation. While the primary factor affecting the light scattering response is a sample’s molecular weight, there is a refractive index element involved. We’ve already discussed how a sample with a dn/dc value of zero will not produce an RI signal; it will not produce a light scattering signal as well. And since the dn/dc term in the light scattering equation is squared, samples with low dn/dc values are sometimes difficult to observe.
All of this is to say that when analyzing a sample using a GPC/SEC system with advanced detectors, knowledge of the dn/dc value is paramount. The dn/dc affects the sample’s raw data in terms of the magnitude of the RI and light scattering signal responses, whether the sample produces a positive or negative peak, and influences the collection of peaks that elute at the column set’s void volume. When analyzing data, the dn/dc value offers a way to determine a sample’s exact concentration at every data slice collected, which can then be used to calculate absolute molecular weight, intrinsic viscosity, and other molecular properties.
Hopefully, you now have a better idea of what a dn/dc value is and the important role it plays in obtaining accurate GPC/SEC characterization data.
Related content:
{{ product.product_name }}
{{ product.product_strapline }}
{{ product.product_lede }}
