
Characteristics Investigation of SiO2 Slurry Samples Widely Used in CMP Employing Light Scattering Method
Introduction
Polishing slurries are used to remove materials on silicon wafer surfaces and to planarize uneven surfaces to prepare wafer surfaces for assembling additional circuit devices. The micro-profiles of wafers are related to the particle size distribution of the slurry used. This is because the size affects the uniformity of dielectric films subsequently processed. The surface charge of the slurry particles determines the stability of the slurry, so the zeta potential can also affect the polishing process.
In this study, two types of silica slurries were used, and light scattering methods were employed to investigate size, distribution, and surface charge characteristics.
Experiment
Slurry particles were measured using Zetasizer Nano ZS, capable of dynamic, static and electrophoretic light scattering measurements.
Sample Preparation
The slurry samples were supplied by Cabot Microelectronics Corporation (Taiwan). Both Sample A and Sample B are silica particles. Sample A is dispersed in an ammonium salt solution with a pH of about 2.5 ~ 4, while Sample B is dispersed in a pH 10 KOH aqueous solution. The zeta potentials of the two dispersed samples were measured with an MPT2 automatic titrator applying various pH values.
Results
Size Measurement
Figure 1 shows particle sizes according to the particle concentration of Sample A. In the dilution region (c < 0.04 wt %), the particle size can be observed to be constant. In the high concentration region, concentration increases show a tendency to decrease in size. At 8% w/v concentration, the measurement of Sample A at different cuvette positions shows size is independent of distance from the cuvette wall. This indicates that size reduction due to concentration is not attributed to the multiple scattering effects but rather accelerated diffusion due to electrostatic interactions between particles.
The concentration effect is also observed in the increase of polydispersity index (PDI) according to the concentration. Understanding this effect is particularly important when measuring charged particles that can interact over long ranges within the electric double layer. When ignoring the concentration effect, only the apparent size and dispersity are measured.
Centrifugation was conducted over time to reduce the particle concentration of Sample A. Figure 2 displays the particle size measured by DLS method as the centrifugation time increases. It can be seen from the figure that both particle size and dispersity decrease with increasing centrifugation time.

Furthermore, the particle size was reduced from 56nm to 47nm, a change attributed to larger particles settling faster in the cuvette during centrifugation. Centrifugation is effective in separating such polydispersed samples by sedimenting heavier particles, thereby reducing the PDI value with increased centrifugation time.
Zeta Potential Measurement
When measured by the DLS method, the slurry sample size, which decreased over time (Figure 2), was not affected by centrifugation time when measuring the zeta potential of the particles. (Figure 3). Therefore, the zeta potential of slurry particles is not sensitive to particle size.

Automatic Titration
An equilibrium is established between the surface of silica particles and the surrounding aqueous medium. Particles tend to gain or lose protons depending on the ambient pH, which may affect the zeta potential. The zeta potential of both Samples A and B was measured using the Zetasizer Nano ZS and MPT2 automatic titrator across various pH levels.

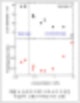
pH was adjusted by adding a KOH solution. At a low pH, Sample A exhibits a positive surface charge, and as pH increases, the zeta potential decreases. At pH 6.03, the dispersion reaches an isoelectric point where the net surface charge becomes 0. Increasing the pH further changes the zeta potential sign from positive to negative.

As for the particle size at each pH, the particle size is greatly increased around the isoelectric point. In the case of Sample B, the zeta potential remains negative consistently within the pH range of 3 to 9.5, as seen in Figure 5.
As the pH decreases, the zeta potential also decreases, and Sample B’s size significantly increases below pH 6.5 at zeta potential less than 4mV, possibly due to a lack of electrostatic repulsion between particles to prevent aggregation.
Discussion
Effects of Concentration on Size and Zeta Potential
The results show that particle diameter maintains consistency only under diluted conditions with free Brownian motion without particle interactions. In high concentration where interparticle interactions occur, the diffusion rate of particles changes, leading to a reduction in particle size. These interactions are very important in DLS measurements but often overlooked.
When the salt content is low, the electrostatic double layer of charged particles expands, allowing these interactions over long distances in dilute solutions. One appropriate method to prevent interactions between particles is to add a suitable amount of salt to the solution, thus effectively blocking the surface charge.
Although centrifugation was used to remove the largest particles and reduce apparent size, the zeta potential of particles showed no effect due to centrifugation. This is because of two reasons: one is that the zeta potential is relatively insensitive to particle size but affected by surface charge density; another important factor is that centrifugation does not change environmental conditions that significantly influence the zeta potential, such as pH and ionic strength.
Effects of pH on Zeta Potential and Particle Size
pH changes the surface charge and affects the zeta potential. Unlike particle size, the zeta potential is a relative concept, and it cannot be described without mentioning measurement conditions like pH and ionic strength.
Zeta potential serves as an indicator of dispersion stability.
Generally, particles exhibit stability when the absolute value of the zeta potential is ±30mV or more. This can be observed in the automatic titration measurements of both Sample A and B.
Figures 4 and 5 show that particle size is constant at high zeta potential, whereas, at zeta potential less than -30mV, the lower electrostatic repulsion results in significantly increased size. Understanding this is vital because particle size, distribution, and uniformity directly influence Chemical Mechanical Polishing (CMP) quality.
Conclusion
In DLS measurements, the size and dispersity of charged particles vary with sample concentration. To measure actual particle size, electrostatic interactions affecting diffusion rates should be considered.
Centrifugation can alter the concentration and distribution of polydispersed samples by selecting smaller particles.
This reduces both particle size and dispersity, but it’s determined that the zeta potential is unrelated to centrifugation.
The zeta potential of slurry samples can be measured up to a concentration of 16% w/v with the Zetasizer Nano. Since centrifugation does not change chemical environments like pH and salt content, it’s a good method for measuring the zeta potential of high concentration samples.
Knowing the optimal pH range can be beneficial for both production and application of CMP slurry.
References
1. Jea-Gun P, Takeo K, Ungyu P, Nanotopography Impact in Shallow Trench Isolation Chemical Mechanical Polishing-Dependence on Slurry Characteristics. Journal of Rare Earths, 2004;z2
2. W. R. Bowen, A. Mongruel, Colloid and surface A, 138, 161-172 , 1998
3. Iler, R K, The Chemistry of Silica: Solubility, Polymerization, Colloid and Surface Properties, and Biochemistry; Wiley: New York, 1979
{{ product.product_name }}
{{ product.product_strapline }}
{{ product.product_lede }}
